Positioning
The other three Data Flow tools look at today's activity. Positioning answers a slower, arguably better question: what actually stayed on the books?
It runs on a daily rhythm built around how options data really works:
- Evening scan — after each close, it snapshots the near-dated option chain for several hundred names — the strikes near the stock's price, filtered to contracts with real open interest or volume — recording each one's open interest, volume, dollars traded, implied volatility, and gamma.
- Morning check — open interest only updates overnight. So each morning, around the open, it re-reads the chains and diffs them:
this morning's OI − last evening's OI= the positions genuinely opened or closed by yesterday's trading.
That overnight diff is the honest version of "flow." Volume says somebody traded; an OI change says the position stayed open. And because everything keys off a once-a-day number, the 15-minute data delay doesn't matter at all here — OI updates overnight for everyone, everywhere.
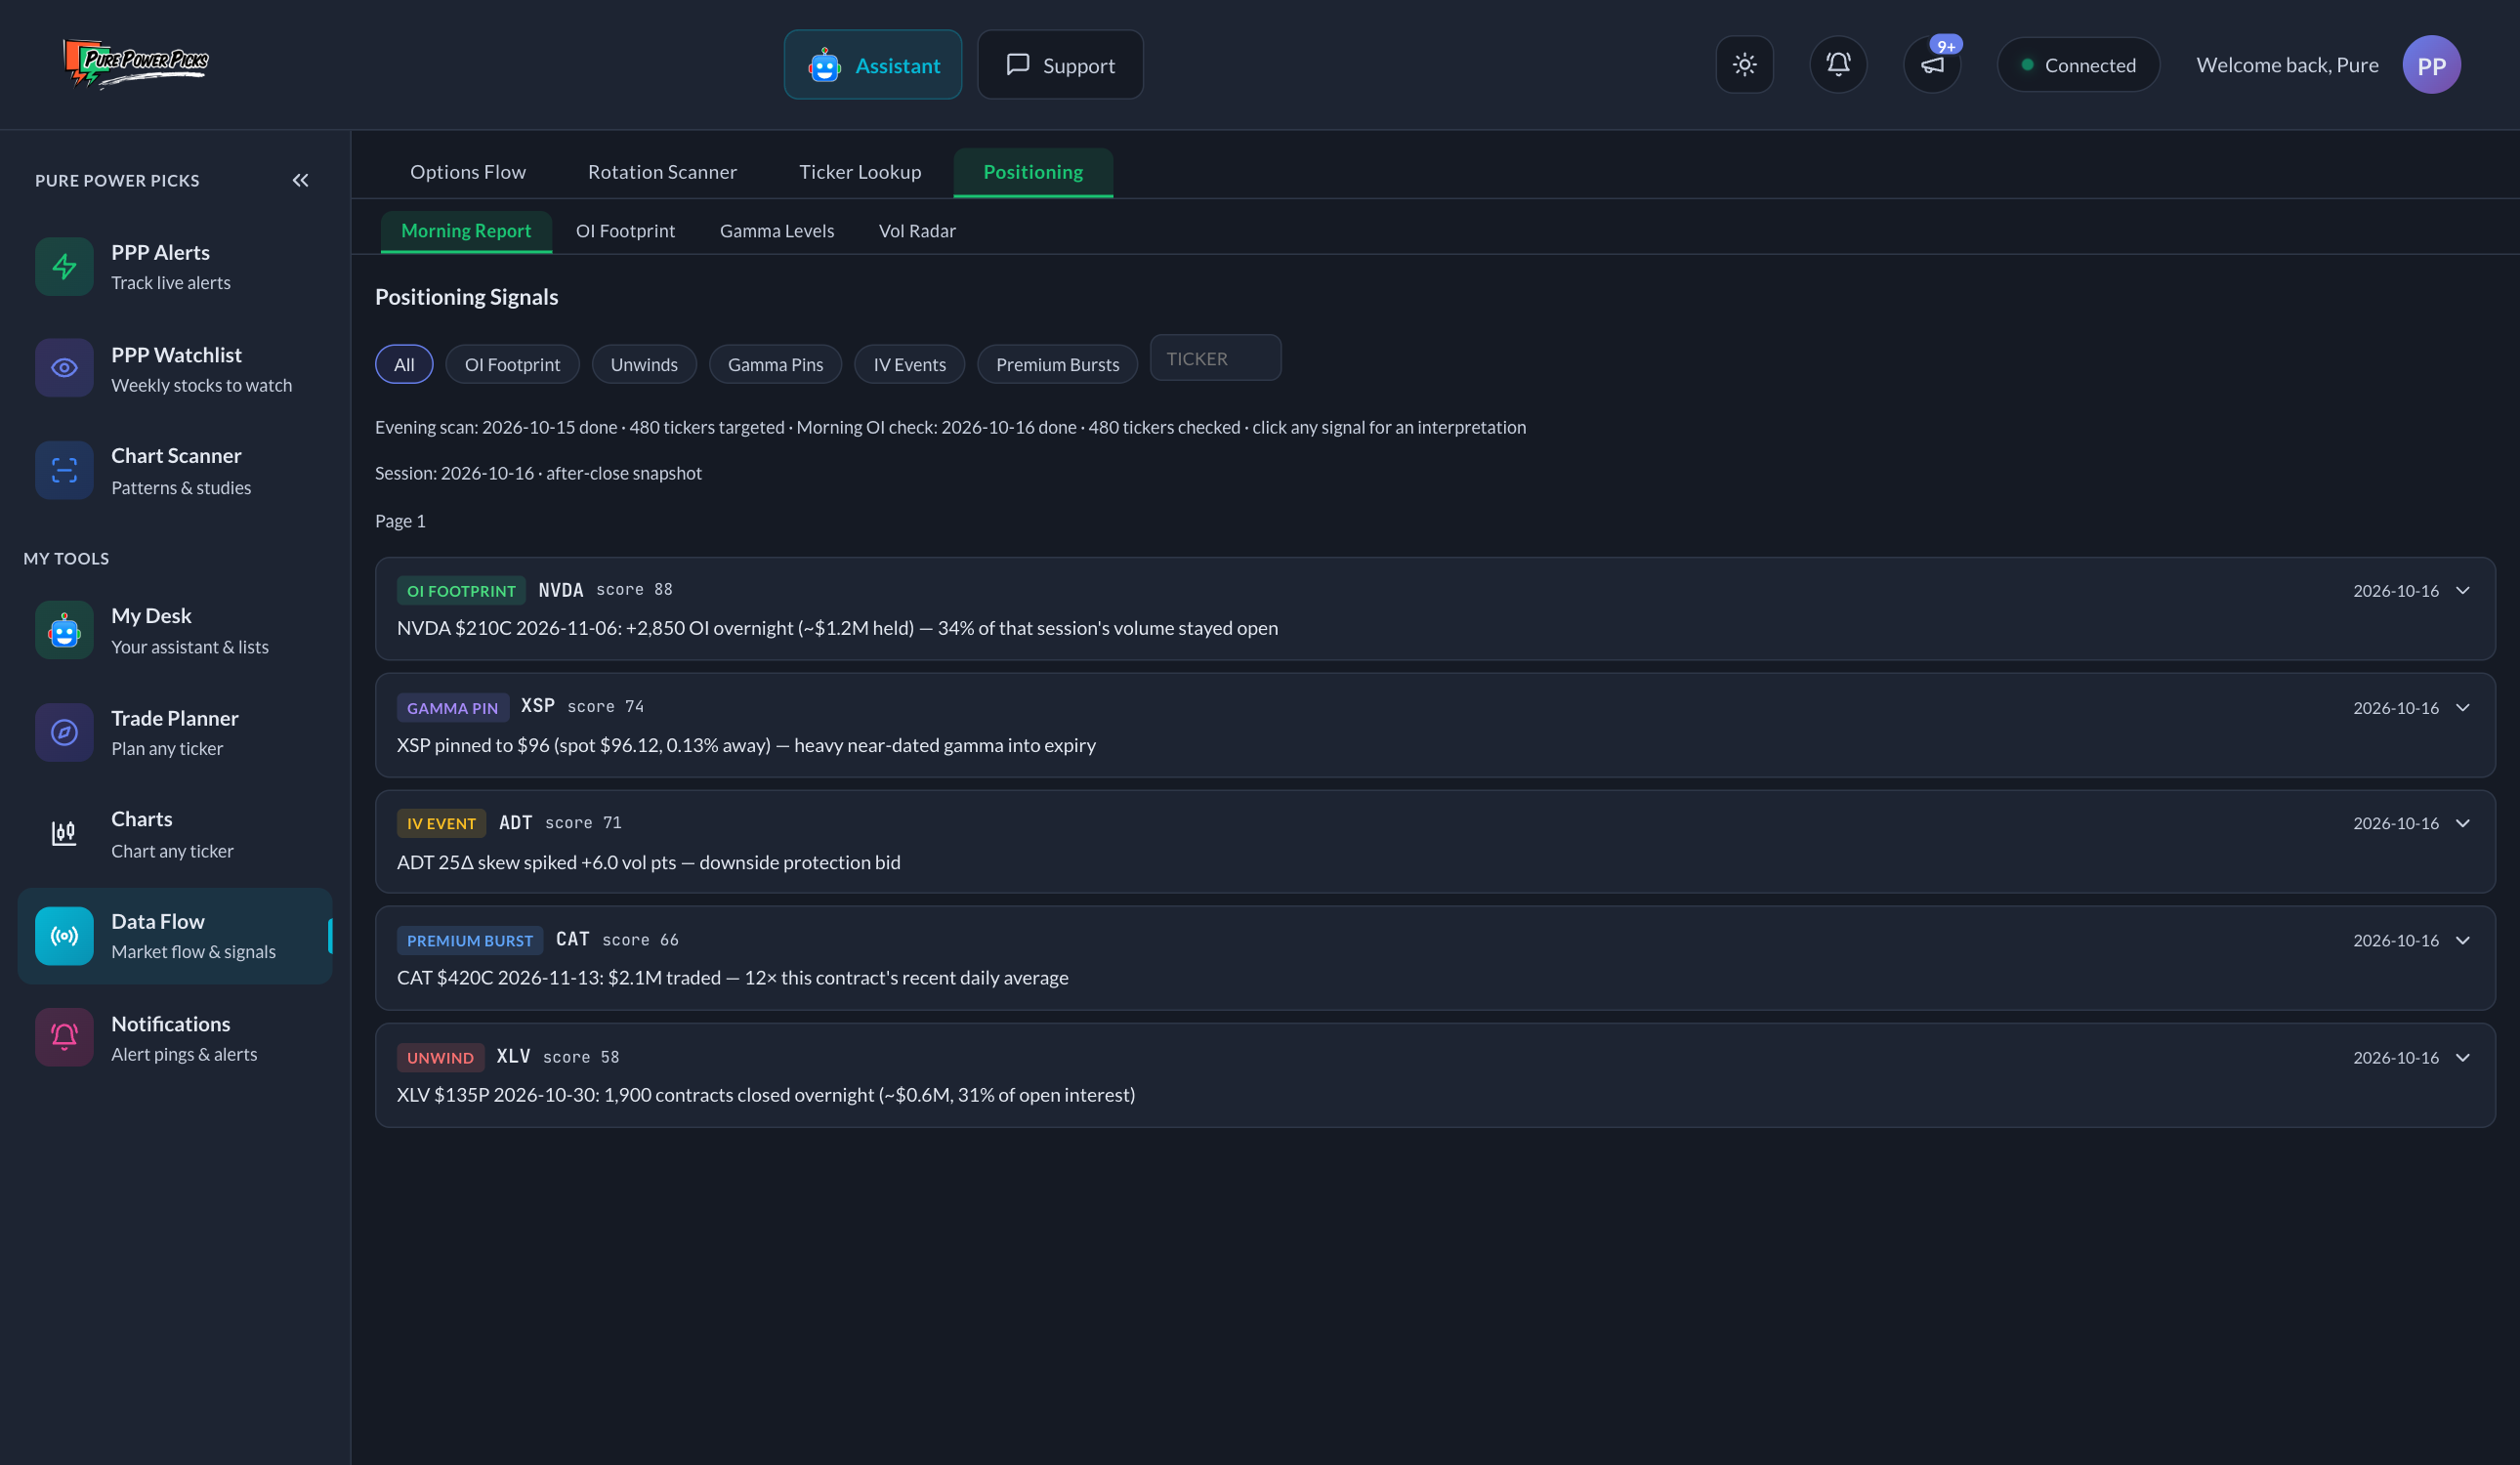
Sample data, for illustration.
The signal types
Every card is one of five signals, each with a plain-English headline and a tap-to-expand interpretation:
| Signal | What it means |
|---|---|
| OI Footprint | A contract's open interest jumped overnight — hundreds of new contracts, real dollars, that survived the session. Someone built a position and kept it. |
| Unwind | The opposite: a large slice of an existing position closed. A thesis being abandoned, profits taken, or a hedge lifted. |
| Gamma Pin | Heavy near-expiry hedging pressure sitting right on top of the current price — the "magnet" effect that can hold a stock near a strike into expiration. |
| IV Event | The volatility surface moved sharply: put protection suddenly bid (skew spike), upside chased (skew collapse), or near-term event premium loading in (term inversion). |
| Premium Burst | A contract traded many times its own recent daily dollar average — activity way outside that contract's normal. |
"Opened," never "bullish"
You'll notice the headlines say things like "+2,400 OI overnight (~$1.8M held)" — never "bullish bet placed." That's deliberate, and it's the most important thing to understand here:
an open interest change carries no direction. Every contract opened has a buyer and a seller, and the data doesn't say which side initiated. New put OI can be bearish bets, protection on shares someone owns, or income sellers collecting premium. So the signals describe what happened to the books — opened, closed, concentrated — and leave the "why" to your research. Any tool that turns OI changes into "smart money is buying" is guessing. This one doesn't.
The sub-tabs
- Morning Report — the full signal feed, filterable by type and ticker. Tap any card for an interpretation of what the signal means mechanically.
- OI Footprint — just the overnight open-interest changes, the anchor dataset.
- Gamma Levels — per-ticker structure: call wall, put wall, pin strike, and the zero-gamma flip. The same levels the Trade Planner cites in its positioning table, from the same pipeline. See Ticker Lookup for the full GEX explainer.
- Vol Radar — the IV events: skew shocks, term-structure inversions, and IV-rank extremes.
A footprint tells you where money committed overnight. It doesn't tell you why, or what happens next — plenty of large positions are hedges, spreads, or wrong. Use it to know where the interest is, then do your own work.