Alert Charts
Alert Charts show every alert as an interactive chart instead of a table row. It's the visual way to scan the board: see how each idea is actually moving, spot the setups at a glance, and star the ones you want to follow.
To open it, go to PPP Alerts and flip the switch at the top from Table to Charts. Until October 2026 this was its own page, the Chart Tracker, and old Chart Tracker links now open it here. The Chart Scanner has its own page.
What it's good for:
- Seeing the move, not just the number. Each chart marks where the alert went out, so you can see whether price ran, stalled or pulled back first.
- Finding the movers fast. Sort by % Move or High (%) and the biggest runners rise to the top.
- Stock or contract. Flip between the stock's candles and the option's own price with one switch.
- A visual watchlist. Star alerts, turn on My Alerts, and set big charts with 1 or 2 columns.
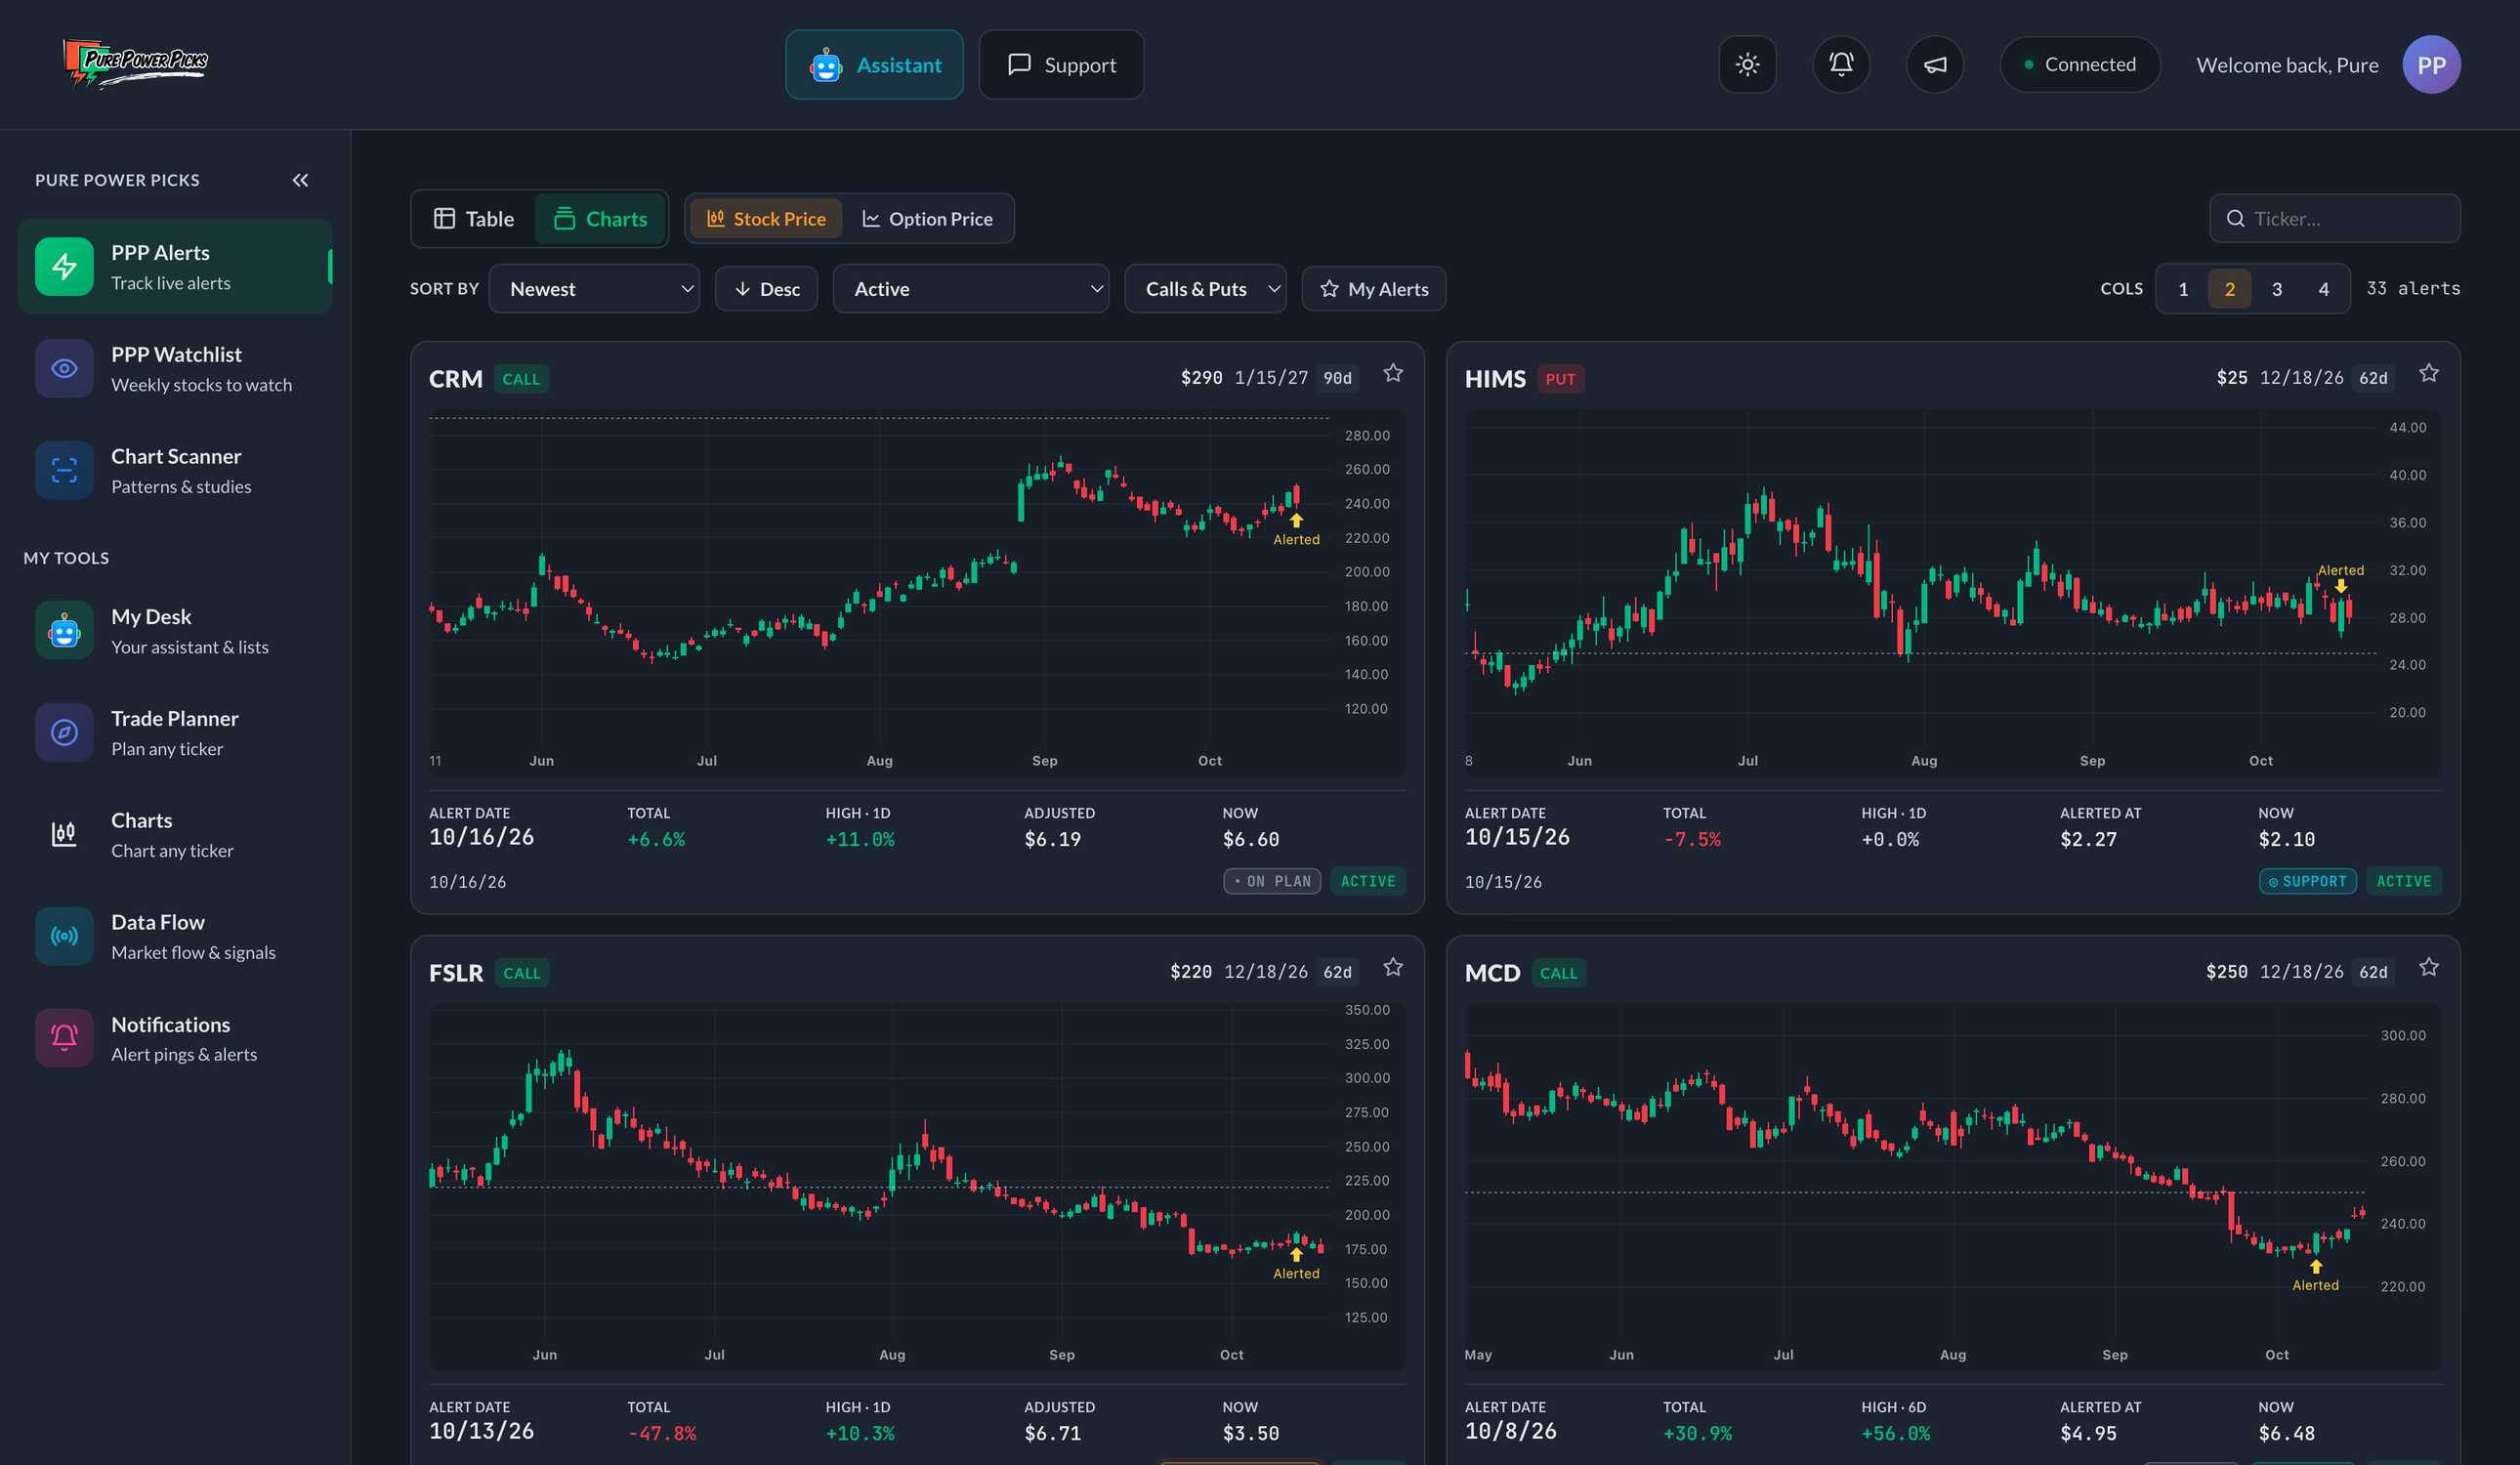
Each card is one alert, plotted as a chart with the alert moment marked, plus its key stats underneath.
Two chart modes
A toggle at the top switches what each card plots:
- Stock Price — a candlestick chart of the underlying stock.
- Option Price — the contract's premium over time (how the option itself has been priced).
Either way, a marker shows where the alert went out, so you can see the move that followed.
What each card shows
Every card is one alert:
- Ticker, type (Call/Put), strike, and expiration
- The chart (stock candles or option premium) with the alert marker
- A DTE badge next to the expiration, counting down the days left (
exponce it's past) - Key stats beneath: Alerted At (the contract's price when the alert went out — shows Adjusted instead, with the adjusted price, on a rebased alert, so the price and the percentages always agree), Now (current), Total % (the move since the alert), and High (the change to High) — plus a headline stat that mirrors your active sort (the period move % when sorting by % Move, the alert date when sorting by Newest, and so on)
- While the contract is active, its current Plan State leads, with the permanent +50% Contract Delivered achievement when earned and Active as lifecycle context.
- After expiration, an evidence-backed Final Review leads; otherwise Expired is the fallback. The +50% achievement and Expired lifecycle remain separate context, while the frozen Plan State stays with the plan evidence on the alert detail page.
- A ⭐ star to add the alert to My Alerts
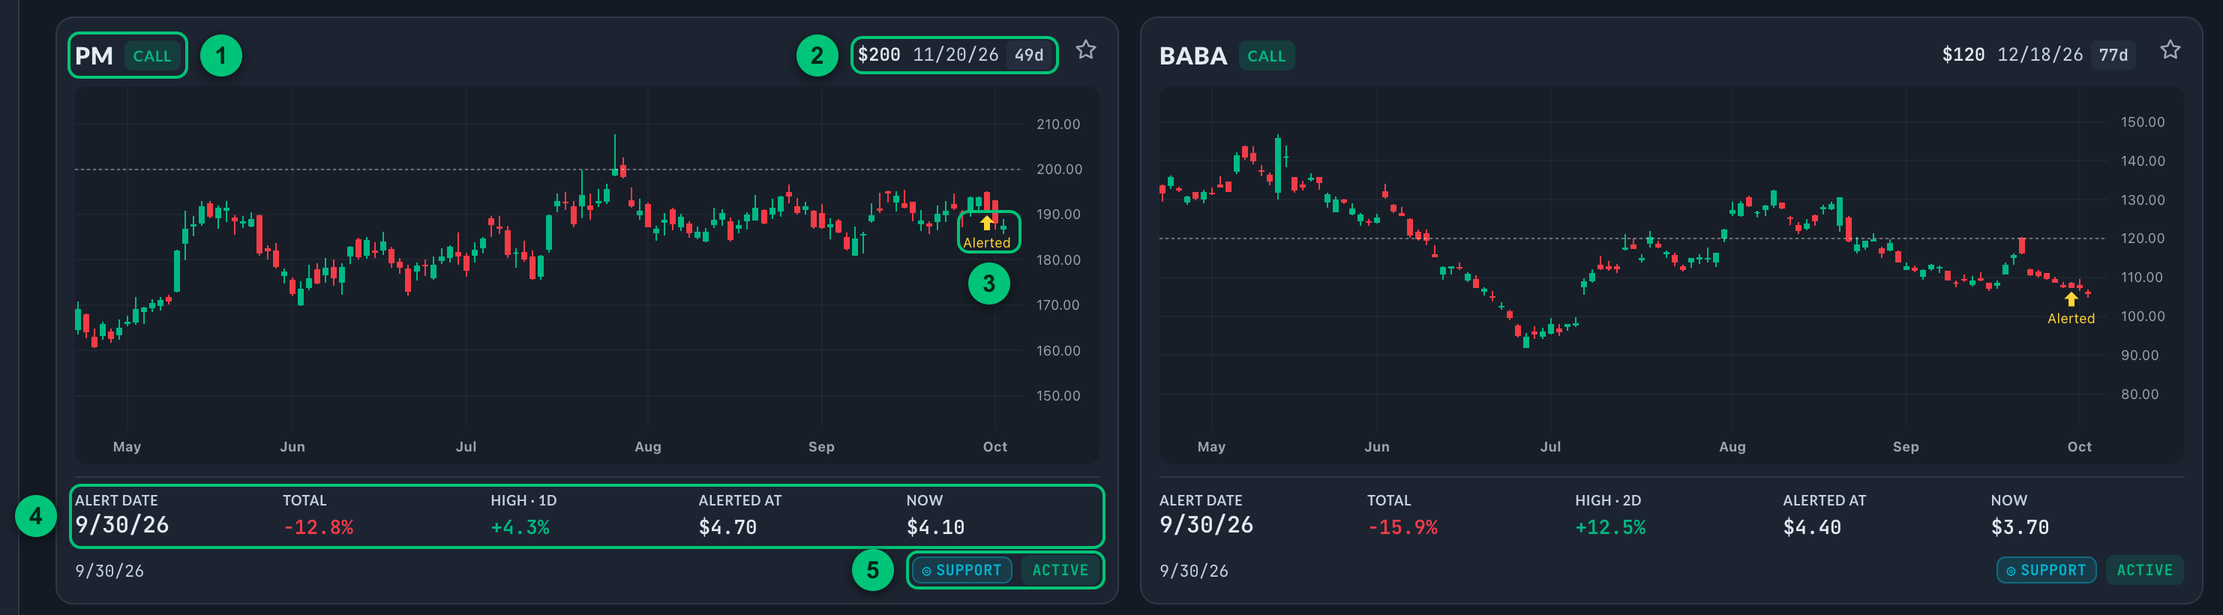
Two cards in Stock Price mode, sorted by Newest, so the headline stat is the alert date.
① Ticker and type — the stock, and Call or Put. ② Strike, expiration and DTE — the badge counts down the days left. ③ Alert marker — where the alert went out. ④ Key stats — the headline stat for your sort, then Total, High, Alerted At and Now. ⑤ Plan State — leads the badges, with Active beside it.
Click any card to open the full alert detail page.
Sorting
Pick a Sort by option and a direction (ascending/descending):
| Sort | Orders by |
|---|---|
| % Move (Current) | The move over the selected time window |
| High (%) | The biggest runners by change to High |
| DTMO | How quickly the High was recorded (market days from the alert) |
| Newest | Most recently alerted first |
| Expiring Soon | Closest to expiration first |
| Ticker | Alphabetical |
Filters & layout
| Control | What it does |
|---|---|
| Status | All alerts · Active · Expired · +50% Contract Delivered. The result filter uses the permanent +50% threshold; +10% and +25% milestones are not classified as delivered contracts. |
| Type | Calls & Puts · Calls · Puts |
| Search | Find a specific ticker |
| My Alerts | Show only your starred alerts |
| Time window | The period the move % is measured over. Appears when sorting by % Move (Current) |
| Columns (1–4) | Desktop only: how many charts per row — denser or larger. Remembered on your device. |
Star the alerts you're following, flip on My Alerts, and set columns to 1 or 2 for big charts — Alert Charts become a clean, visual board of just your ideas. Your stars sync across devices.
On Free Access
Free Access has the same Table | Charts switch on PPP Alerts. Charts shows the alerts included in your Free access, expired ones too, with both chart modes, sorting, filters and stars. The % Move window offers 1D and All (since the alert). Each of those alerts' own pages shows the same stock chart, with the plan's levels drawn on.
The charts show historical price action for the alerted contract and its stock — for educational purposes, not a recommendation or a record of trades. See the disclaimer.