Reading an Alert
Click any alert on the home page to open its detail page — the complete picture of a single idea. This is where the thesis, the exact price levels, the charts, and your own notes all live in one place.
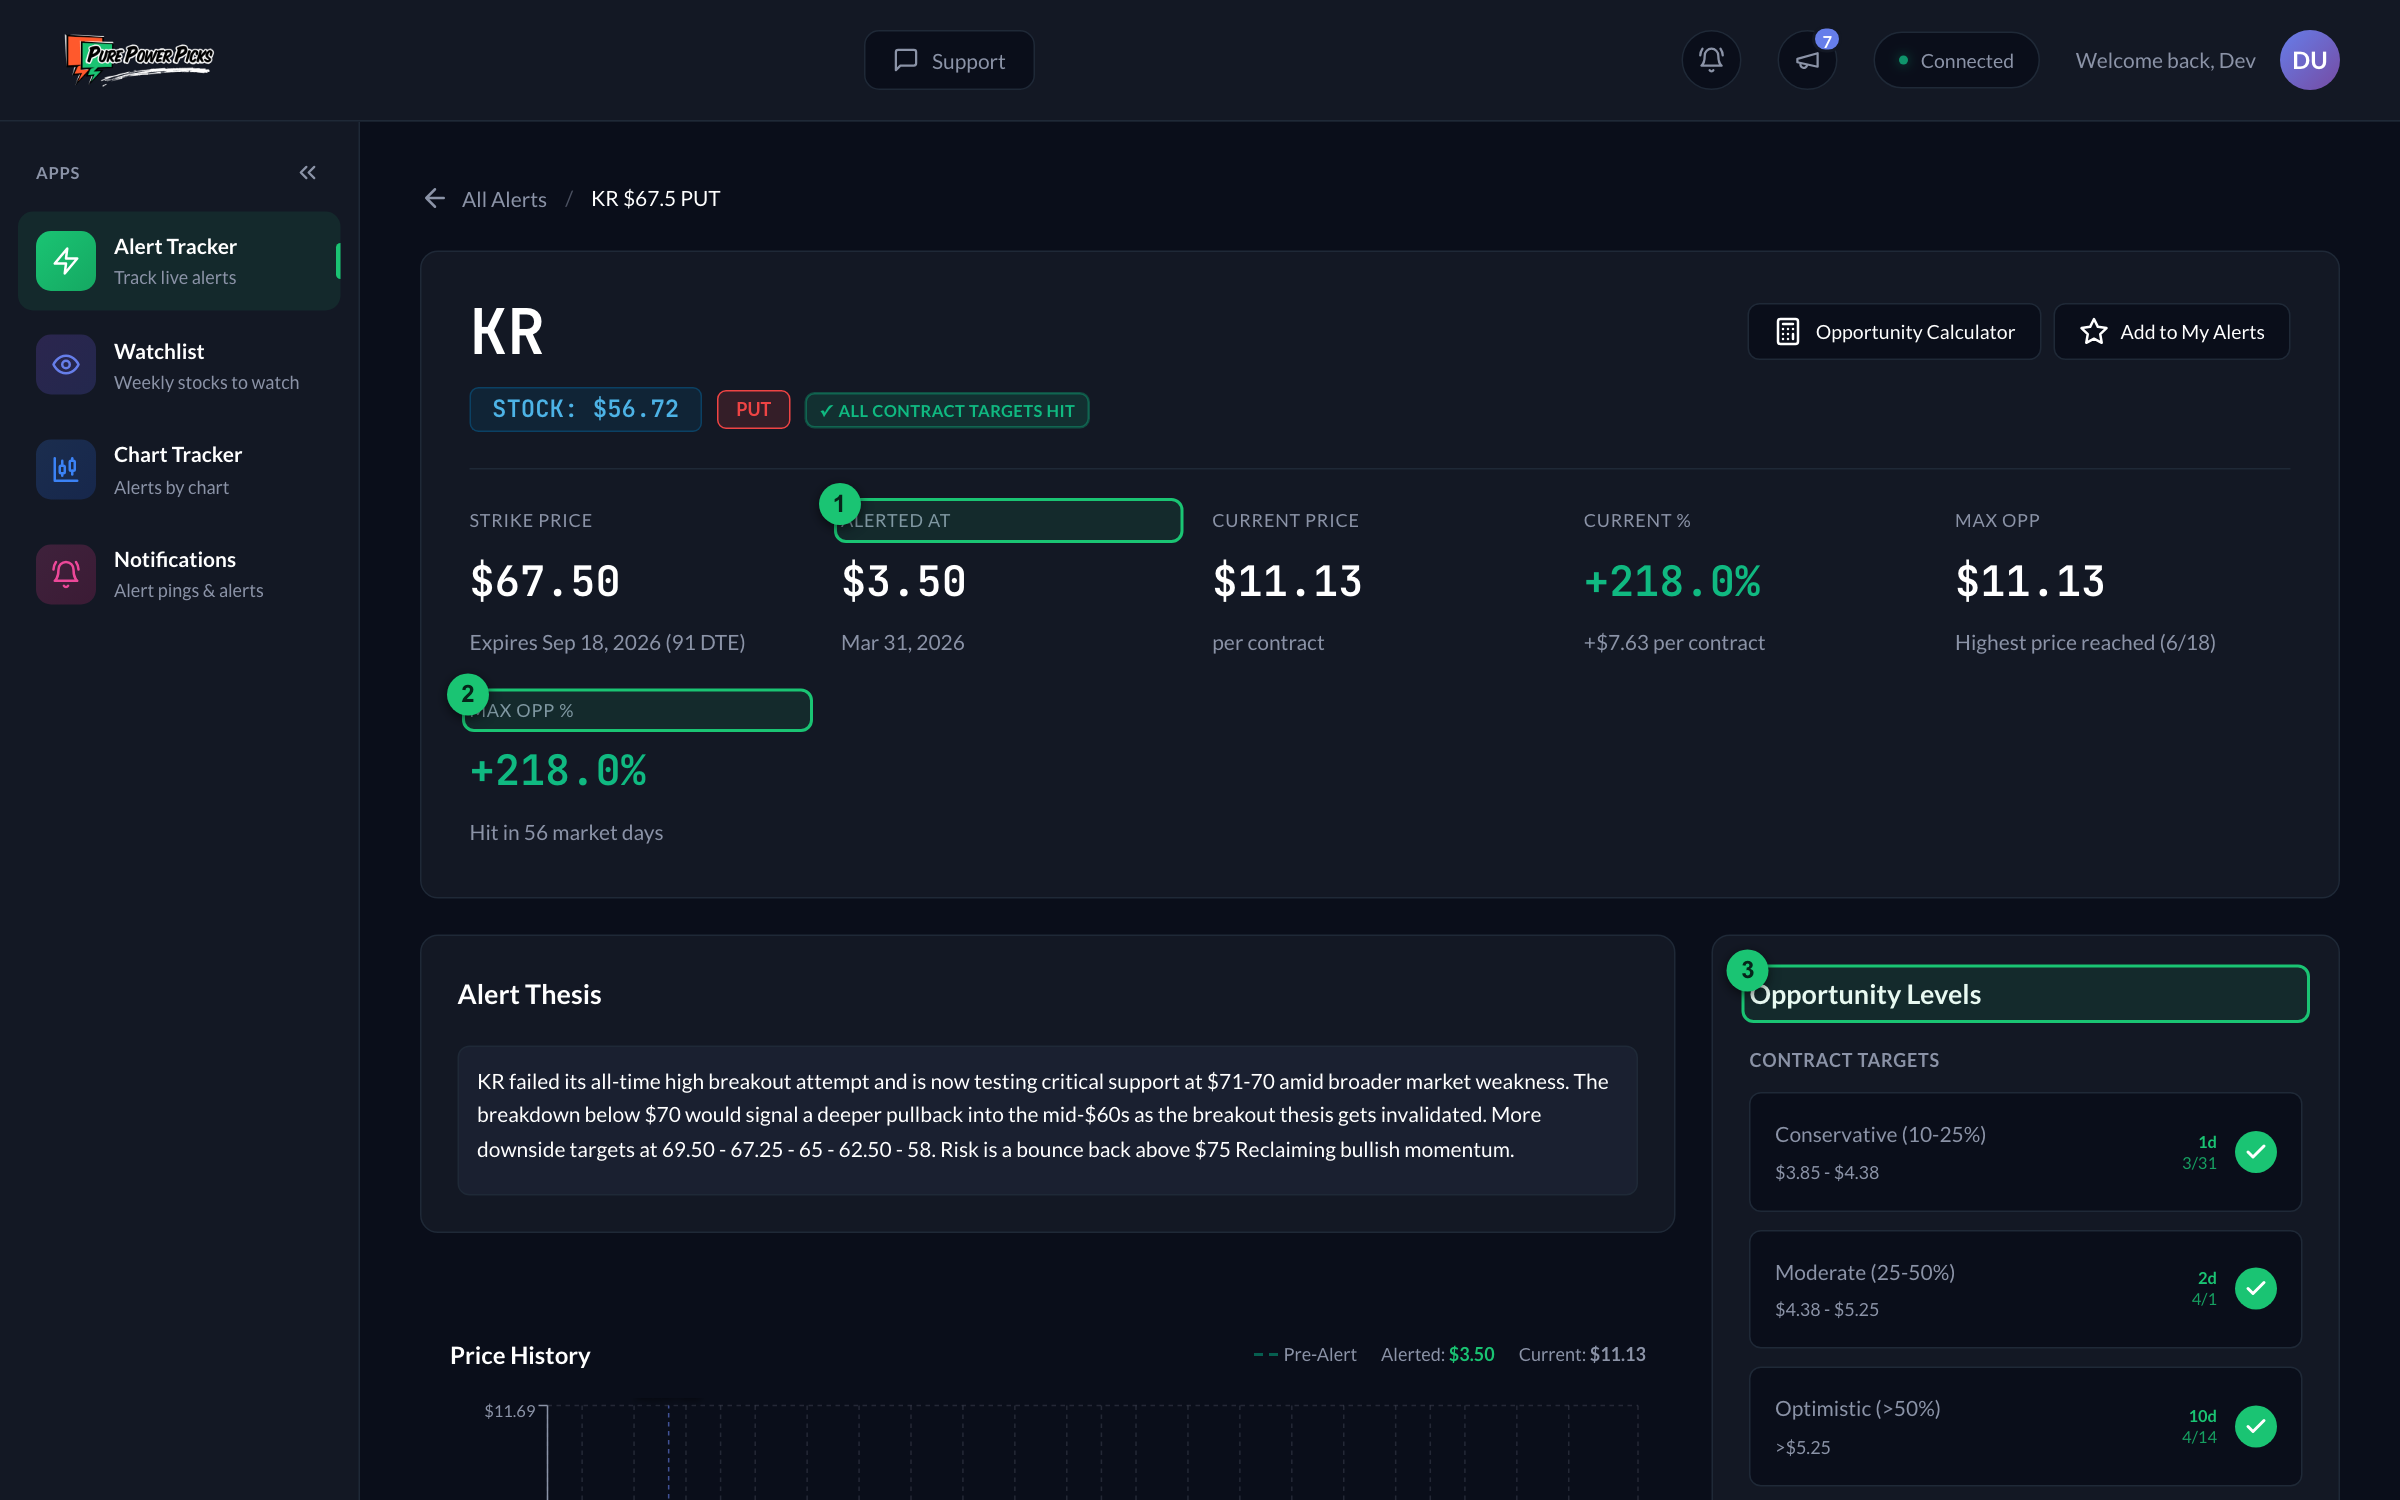
① Alerted At — the baseline price the trade is measured from. ② Max Opp % — how far the contract ran at its peak, and how many market days it took. ③ Opportunity Levels — the contract targets (Conservative / Moderate / Optimistic) and whether each has been hit.
The header
At the top you'll find the essentials and the main actions:
- Ticker, company name, and exchange, with the current stock price and an ITM / OTM badge (whether the option is in‑ or out‑of‑the‑money).
- The contract: strike, type (call/put), and expiration.
- The live status badge(s).
- ⭐ Add to My Alerts — save it to your synced list.
- 🧮 Opportunity Calculator — open the what‑if heat map.
The metrics row
A row of key numbers, the same ones from the alerts table but with more context:
- Strike Price and expiration.
- Alerted At / Tracked At — the baseline price, with a note on its entry state ("bid awaiting fill", "tracking adjusted", or the fill date).
- Current Price — the contract right now.
- Current % — current performance, with the dollar change underneath.
- Max Opp and Max Opp % — the peak and how far it ran, plus the date and market days it took.
Opportunity Levels
This panel translates the thesis into concrete prices and shows which have been reached.
Contract targets — three tiers of opportunity on the option itself, each marked with a ✓ and date once reached:
- Conservative — roughly a 10–25% move.
- Moderate — roughly 25–50%.
- Optimistic — 50%+.
Stock price levels — the levels the thesis is built on, each showing whether the live stock price has tagged it:
- Support / Resistance — the floors (calls) or ceilings (puts) the idea depends on.
- Targets (T1, T2, T3) — where the stock is headed if the thesis works.
- Critical level / stop — the price that would invalidate the idea.
A short plain‑language summary (with an emoji) sums up the read, e.g. "📈 Thesis intact, working as planned" or "⚠ Critical level tested."
Status Analysis
A deeper breakdown of the live status: every badge that currently applies, the support/resistance levels (S1, S2 / R1, R2), the targets (T1–T3), the breakout/breakdown trigger, and the current stock price — so you can see exactly why the alert is in the state it's in.
Charts
- Option Price Chart — the contract's price history since the alert, with markers for the 10% / 25% / 50% opportunity levels.
- Stock Chart — a full interactive TradingView chart of the underlying, with the thesis's support, resistance, and target levels drawn right on it, plus a marker on the alert date.
AI Analysis
An automatically generated, plain‑English read on the price action — how the contract and the stock have behaved, how the move is tracking against the thesis, and where the risks are. It's a quick narrative summary to complement the numbers.
Activity Feed
A timeline of everything that's happened to the alert: milestones reached, targets tagged, levels tested, status changes. A running history of the idea.
Your Notes
A private notes box where you can jot your own thoughts on the alert. Click Save and they're stored for you.
Your notes are saved in your browser on the device you wrote them on. They aren't synced across devices. Your starred alerts, by contrast, do sync everywhere you're signed in.
Next
- Opportunity Calculator → — explore hypothetical outcomes at any price and date.
- Alert Statuses → — decode the badges you see here.