Opportunity Calculator
The Opportunity Calculator is a "what‑if" machine. It shows you what a contract would hypothetically be worth — and what the resulting gain or loss would be — at any stock price, on any date between now and expiration. It's the best way to build intuition for how an option behaves before and as it moves.
You open it from the 🧮 Opportunity Calculator button on any alert detail page. It opens as a pop‑up over the alert.
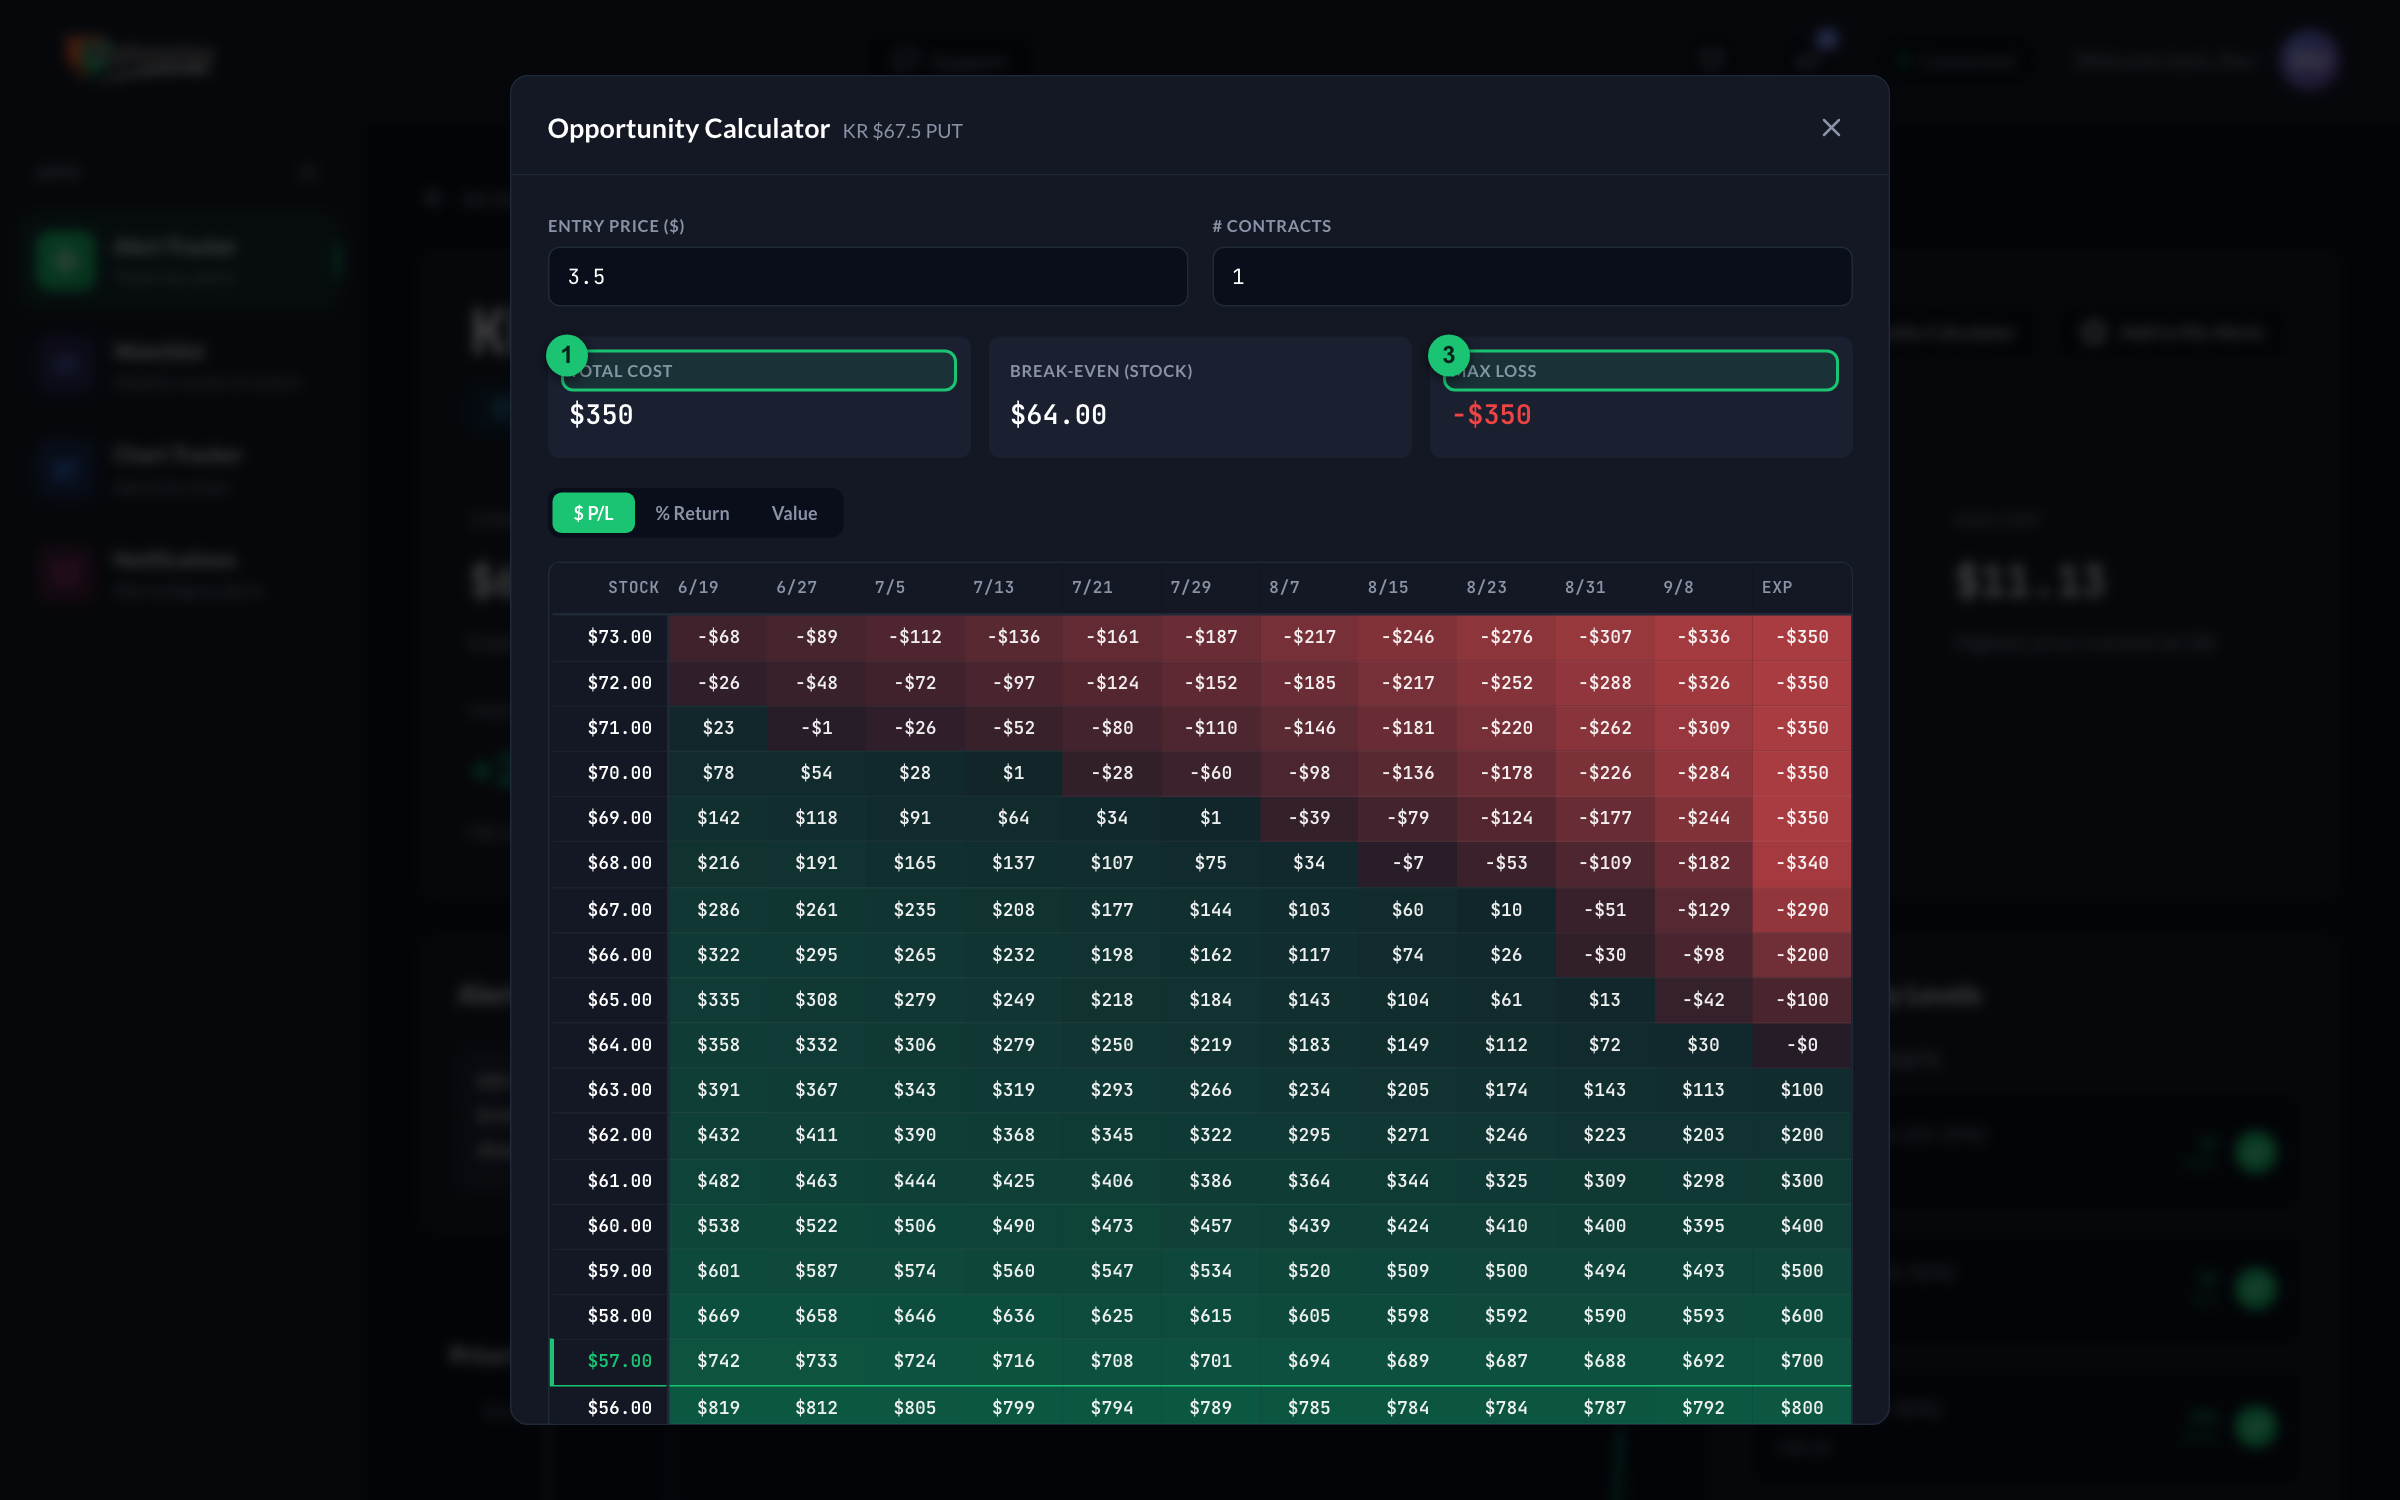
① Total Cost — what the modeled position would cost. ② Break‑Even — the stock price at expiration where you'd come out even. ③ Max Loss — the most that could be lost. Below: the heat map — stock price down the rows, dates across to expiration, green = gain, red = loss.
What you're looking at
The centerpiece is a heat map — a color‑coded grid:
- Each row is a stock price (a range above and below where the stock trades now).
- Each column is a date, from today out to expiration (the last column is labeled Exp).
- Each cell shows the outcome if the stock were at that price on that date.
- Colors: green = gain, red = loss, brighter = bigger. Near‑breakeven cells are pale.
- The current stock price row is highlighted so you can find your bearings instantly.
How to read it
- Find the current stock price in the left column (it's highlighted).
- Read across to today's date (first column) — that's the contract's hypothetical value/return right now.
- Move right to see how time alone changes things — this is time decay in action: all else equal, options lose value as expiration approaches.
- Move up or down rows to see what happens if the stock rises or falls.
Together, the grid shows the interplay of the two forces that move every option: price (up/down the rows) and time (left to right across the columns).
The controls
| Control | What it does |
|---|---|
| Entry Price | The price per contract to measure from. Defaults to the alert's alerted price; change it to model a different starting point. |
| # Contracts | How many contracts to model. Each contract represents 100 shares, so this scales the dollar figures. |
| Display Mode | Switch what each cell shows: $ P/L (dollar gain/loss), % Return (percentage on your entry), or Value (the contract's modeled price). |
The summary cards
Above the grid, three cards give you the key reference points:
| Card | What it means |
|---|---|
| Total Cost | What it would cost to buy the modeled position: entry price × 100 × number of contracts. |
| Break‑Even | The stock price at expiration where the outcome is exactly zero. For a call: strike + entry price. For a put: strike − entry price. |
| Max Loss | The most that could be lost — for an option buyer, that's the total cost (a contract can expire worthless). |
How the numbers are produced
The calculator uses the Black‑Scholes model — the standard options‑pricing formula — to estimate the contract's value in every scenario. It first reads the contract's current implied volatility from its live price, then re‑prices it across the grid of stock prices and dates.
The heat map is a model. It assumes implied volatility stays constant and ignores dividends, commissions, and slippage, and at expiration it values the contract at its intrinsic value only. Real markets are messier. Use the calculator to understand how options behave — not as a forecast of what will happen or a promise of any outcome. Nothing here is financial advice; see the disclaimer.
Expired contracts
If the contract has already expired, the calculator runs in post‑mortem mode (a banner says so). The grid still works, but with no time left, every value reflects intrinsic value only — useful for reviewing how an idea ultimately played out.
Terms worth knowing
The calculator touches several options concepts. All are defined in the Glossary: Black‑Scholes, implied volatility (IV), time decay (theta), breakeven, intrinsic value, and ITM / OTM.