High
In Options view, High is the highest recorded price of the option contract after the alert. High (%) is how far that High sits above the alerted price. Together they answer one question:
How far did this contract run at its best, after the alert went out?
Until October 2026 these were called Max Opp (the price) and Max Opp % (the percent), short for Max Opportunity. The numbers did not change, only the names. Older posts, emails and screenshots may still use the old names.
High is a recorded measurement of the market after the alert. It is not a realized return, and not something any member necessarily captured.
How it's calculated
High (%) = (High − Alerted price) ÷ Alerted price × 100
(For adjusted alerts, the baseline is the adjusted price, the one performance is honestly measurable from.)
Example: an alert goes out with the contract at $3.50. Over the next two weeks the contract trades as high as $6.50, then settles back. The change to High is:
($6.50 − $3.50) ÷ $3.50 × 100 = +85.7%
So High shows $6.50 and High (%) shows +85.7%, no matter where the contract trades afterward.
For current alerts, the High comes from real minute‑by‑minute trading, using each minute's closing price, starting from the moment the alerted bid traded. That deliberately filters out one‑off outlier prints (a single trade at a silly price inside a wide bid/ask spread doesn't count), so the High is a number you could realistically have seen on screen, not a phantom tick. It is tracked through the contract's expiration day. Alerts from earlier years were recorded with the methods in use at the time, so treat any High as the highest recorded price.
High vs. Current: they're different on purpose
This is the one thing worth internalizing:
| What it answers | Behavior | |
|---|---|---|
| High (%) | How far did it run at its best? | The highest recorded price since the alert. Only ever goes up (or stays put). |
| Current % | Where is it right now? | Live price vs. the alerted price. Goes up and down all day. |
It's completely normal to see a change to High of +120% next to Current +35%. The contract ran to +120% at its High, then pulled back to +35%. The High already happened: it's a record of the best the move offered.
How the High feeds Final Review
Once a contract expires, the tracker can replace its live Status with a permanent Final Review. It uses a +50% change to High as the result mark:
- Below +50% is Fell short.
- At or above +50%, the path to the High becomes Smooth, Dipped first, or Deep dip first.
That path is measured from the alert's recorded tracking price using closing option prices through the High. A pullback under 20% is Smooth; 20% to under 55% is Dipped first; 55% or more is Deep dip first. Hover, focus, or tap the result to see the change to High, biggest pullback, High date, and tracking price.
The label is intentionally stored as a versioned final snapshot. The browser does not infer it from the High currently on screen, and an alert stays simply Expired when its full evidence is unavailable. See Alert Statuses for all four labels.
Best Move is a separate measure
The table's Stock view uses a related measure called Best Move (formerly Max Stock Opp). It measures the underlying stock from the Stock Alerted At baseline rather than measuring the option contract:
- For a bullish idea, it uses the best recorded post-alert stock high.
- For a bearish idea, it uses the best recorded post-alert stock low, so a falling stock counts as a favorable move.
- If no favorable move has appeared, it stays at 0.0% instead of presenting an unfavorable move as the best one.
Because a bearish idea's best move is a low, Best Move is deliberately not called a High.
Best Move does not shrink after a pullback. The adjacent Now field is the live snapshot that moves up and down. The tracker also treats the alert day conservatively: the current post-alert quote can count, but a stored full-session daily high or low is excluded because that extreme may have happened before the alert was published.
Like the option High, Best Move records the best move observed after the alert. It is not an assumed entry, exit, or realized member result. See the Stock-view column guide for the complete table behavior.
The High date and how fast it moved
Directly under the percentage, the High (%) cell shows when the High was recorded and how many market days it took (the DTMO):
2/23 (5d)
That reads as: the High was recorded on February 23rd, on the alert's 5th market day, counting the alert day itself as day 1. ("Market days" counts only trading days: it skips weekends and holidays, and a High on the alert day shows 1d.) This tells you how quickly the opportunity developed.
A High from a previous year carries the year, as 12/2/25. Hover the cell for the full written-out date.
Milestones
As a contract's change to High climbs, it passes milestones. In the Classic (spreadsheet) view, you'll see cells fill in green as each threshold is crossed:
+10% · +20% · +30% · +40% · +50% · +75% · +100%
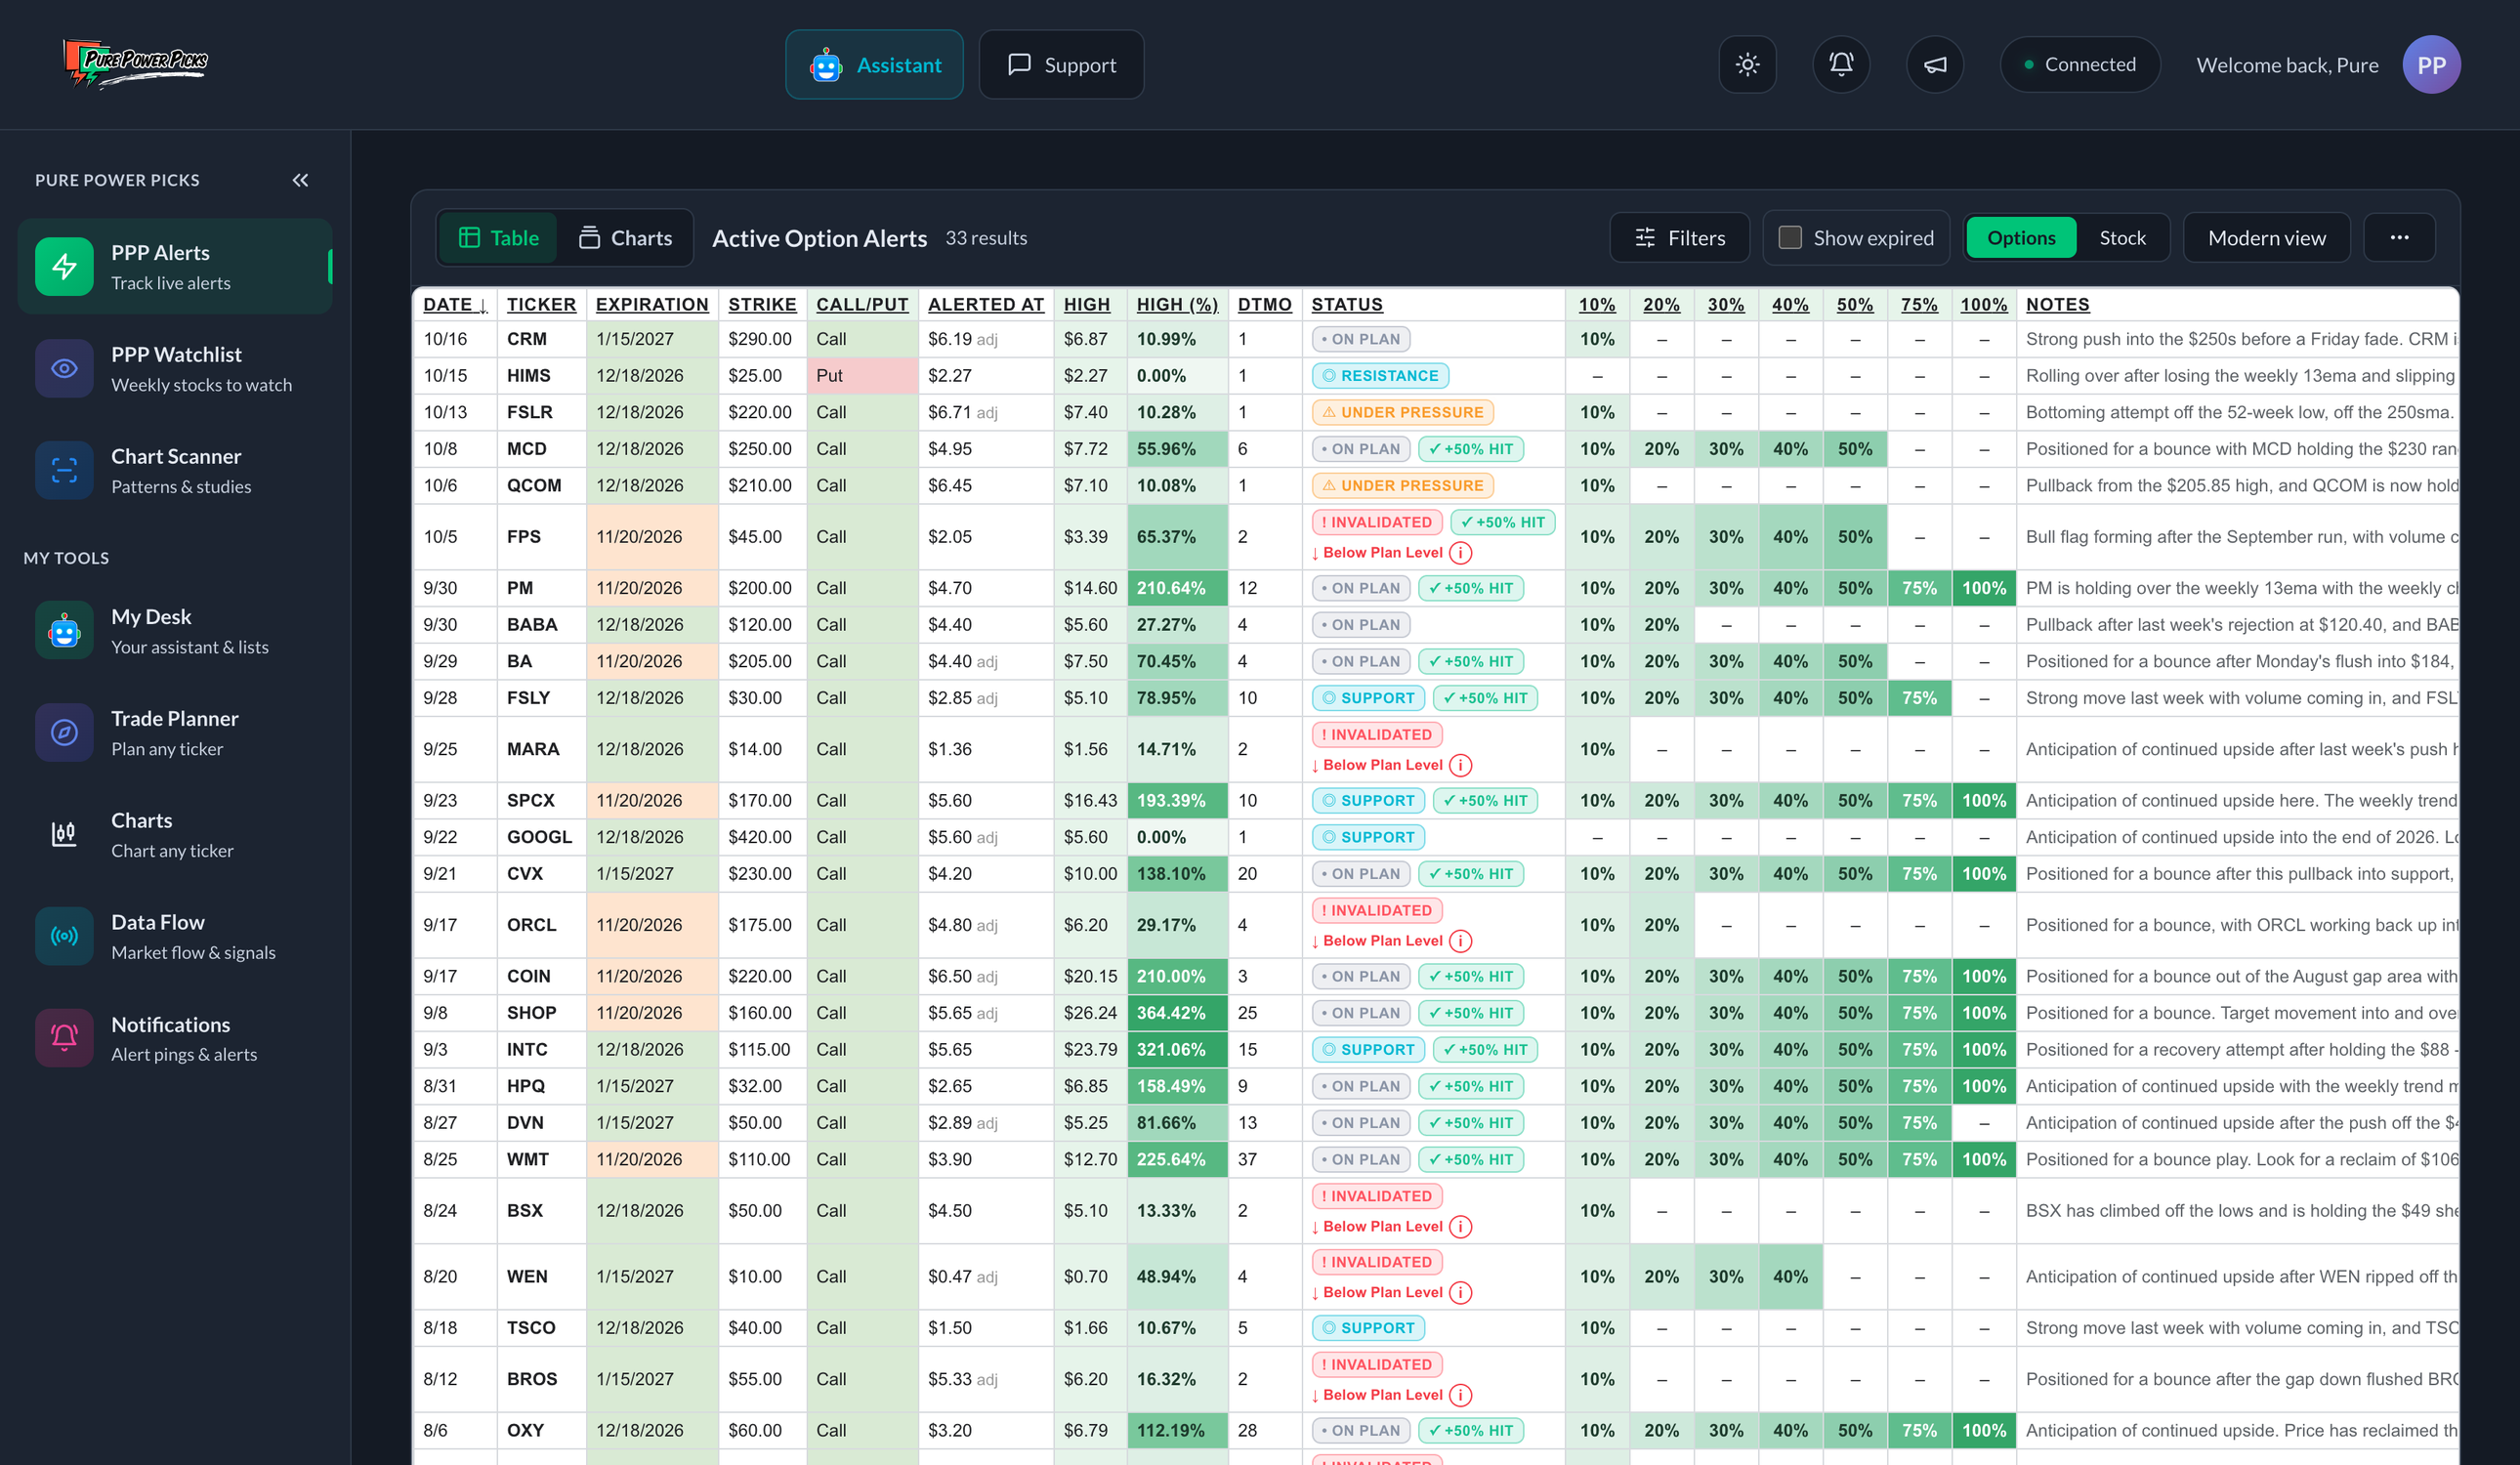
Classic view turns the milestones into columns: each one fills green as an alert's change to High crosses that threshold, so you can scan how far every alert traveled.
If you've turned on notifications, you can be pinged as an alert crosses the major milestones:
+25% · +50% · +75% · +100%, and then every additional +100% on rare runaway moves.
What the High is, and isn't
The High is a measure of the opportunity an alert presented, not a profit you earned. It's the contract's highest recorded price after the alert. Capturing it would have required selling at exactly the right moment, which no one does perfectly, and not every idea reaches its targets; some draw down first. Treat it as the ceiling of what the move offered, useful for judging the quality of an idea over time. It is not a record of realized gains. See the disclaimer.
Best Move: the same idea, on the underlying
The High above is measured on the option contract. The Stock view and every alert's detail page also show Best Move: the best favorable move the stock made after the alert, with no option premium in the math.
Two differences worth knowing:
- History comes from recorded daily bars after the alert day, plus the live quote while the contract is active, so it's accurate to the trading day rather than the exact tick. The alert day's own daily high and low are deliberately excluded, since that extreme may have happened before the alert went out.
- It follows the idea's direction: for a bearish idea the best post‑alert low counts, so a stock falling registers as favorable.
The same caveat applies in full: it's the opportunity the move offered, not a result anyone banked.
Next
- The Alerts Table →: where the High lives alongside every other column.
- Opportunity Calculator →: model hypothetical outcomes at any price and date.