Rotation Scanner
Money in the market doesn't just come and go — it moves around. Out of tech and into energy, out of growth and into staples. That drift is called sector rotation, and catching it early is the whole point of this scanner.
Twice each trading day it measures all 11 sector ETFs, the major market ETFs, and ~90 large sector stocks, scoring each on six independent bullish checks and six independent bearish checks.
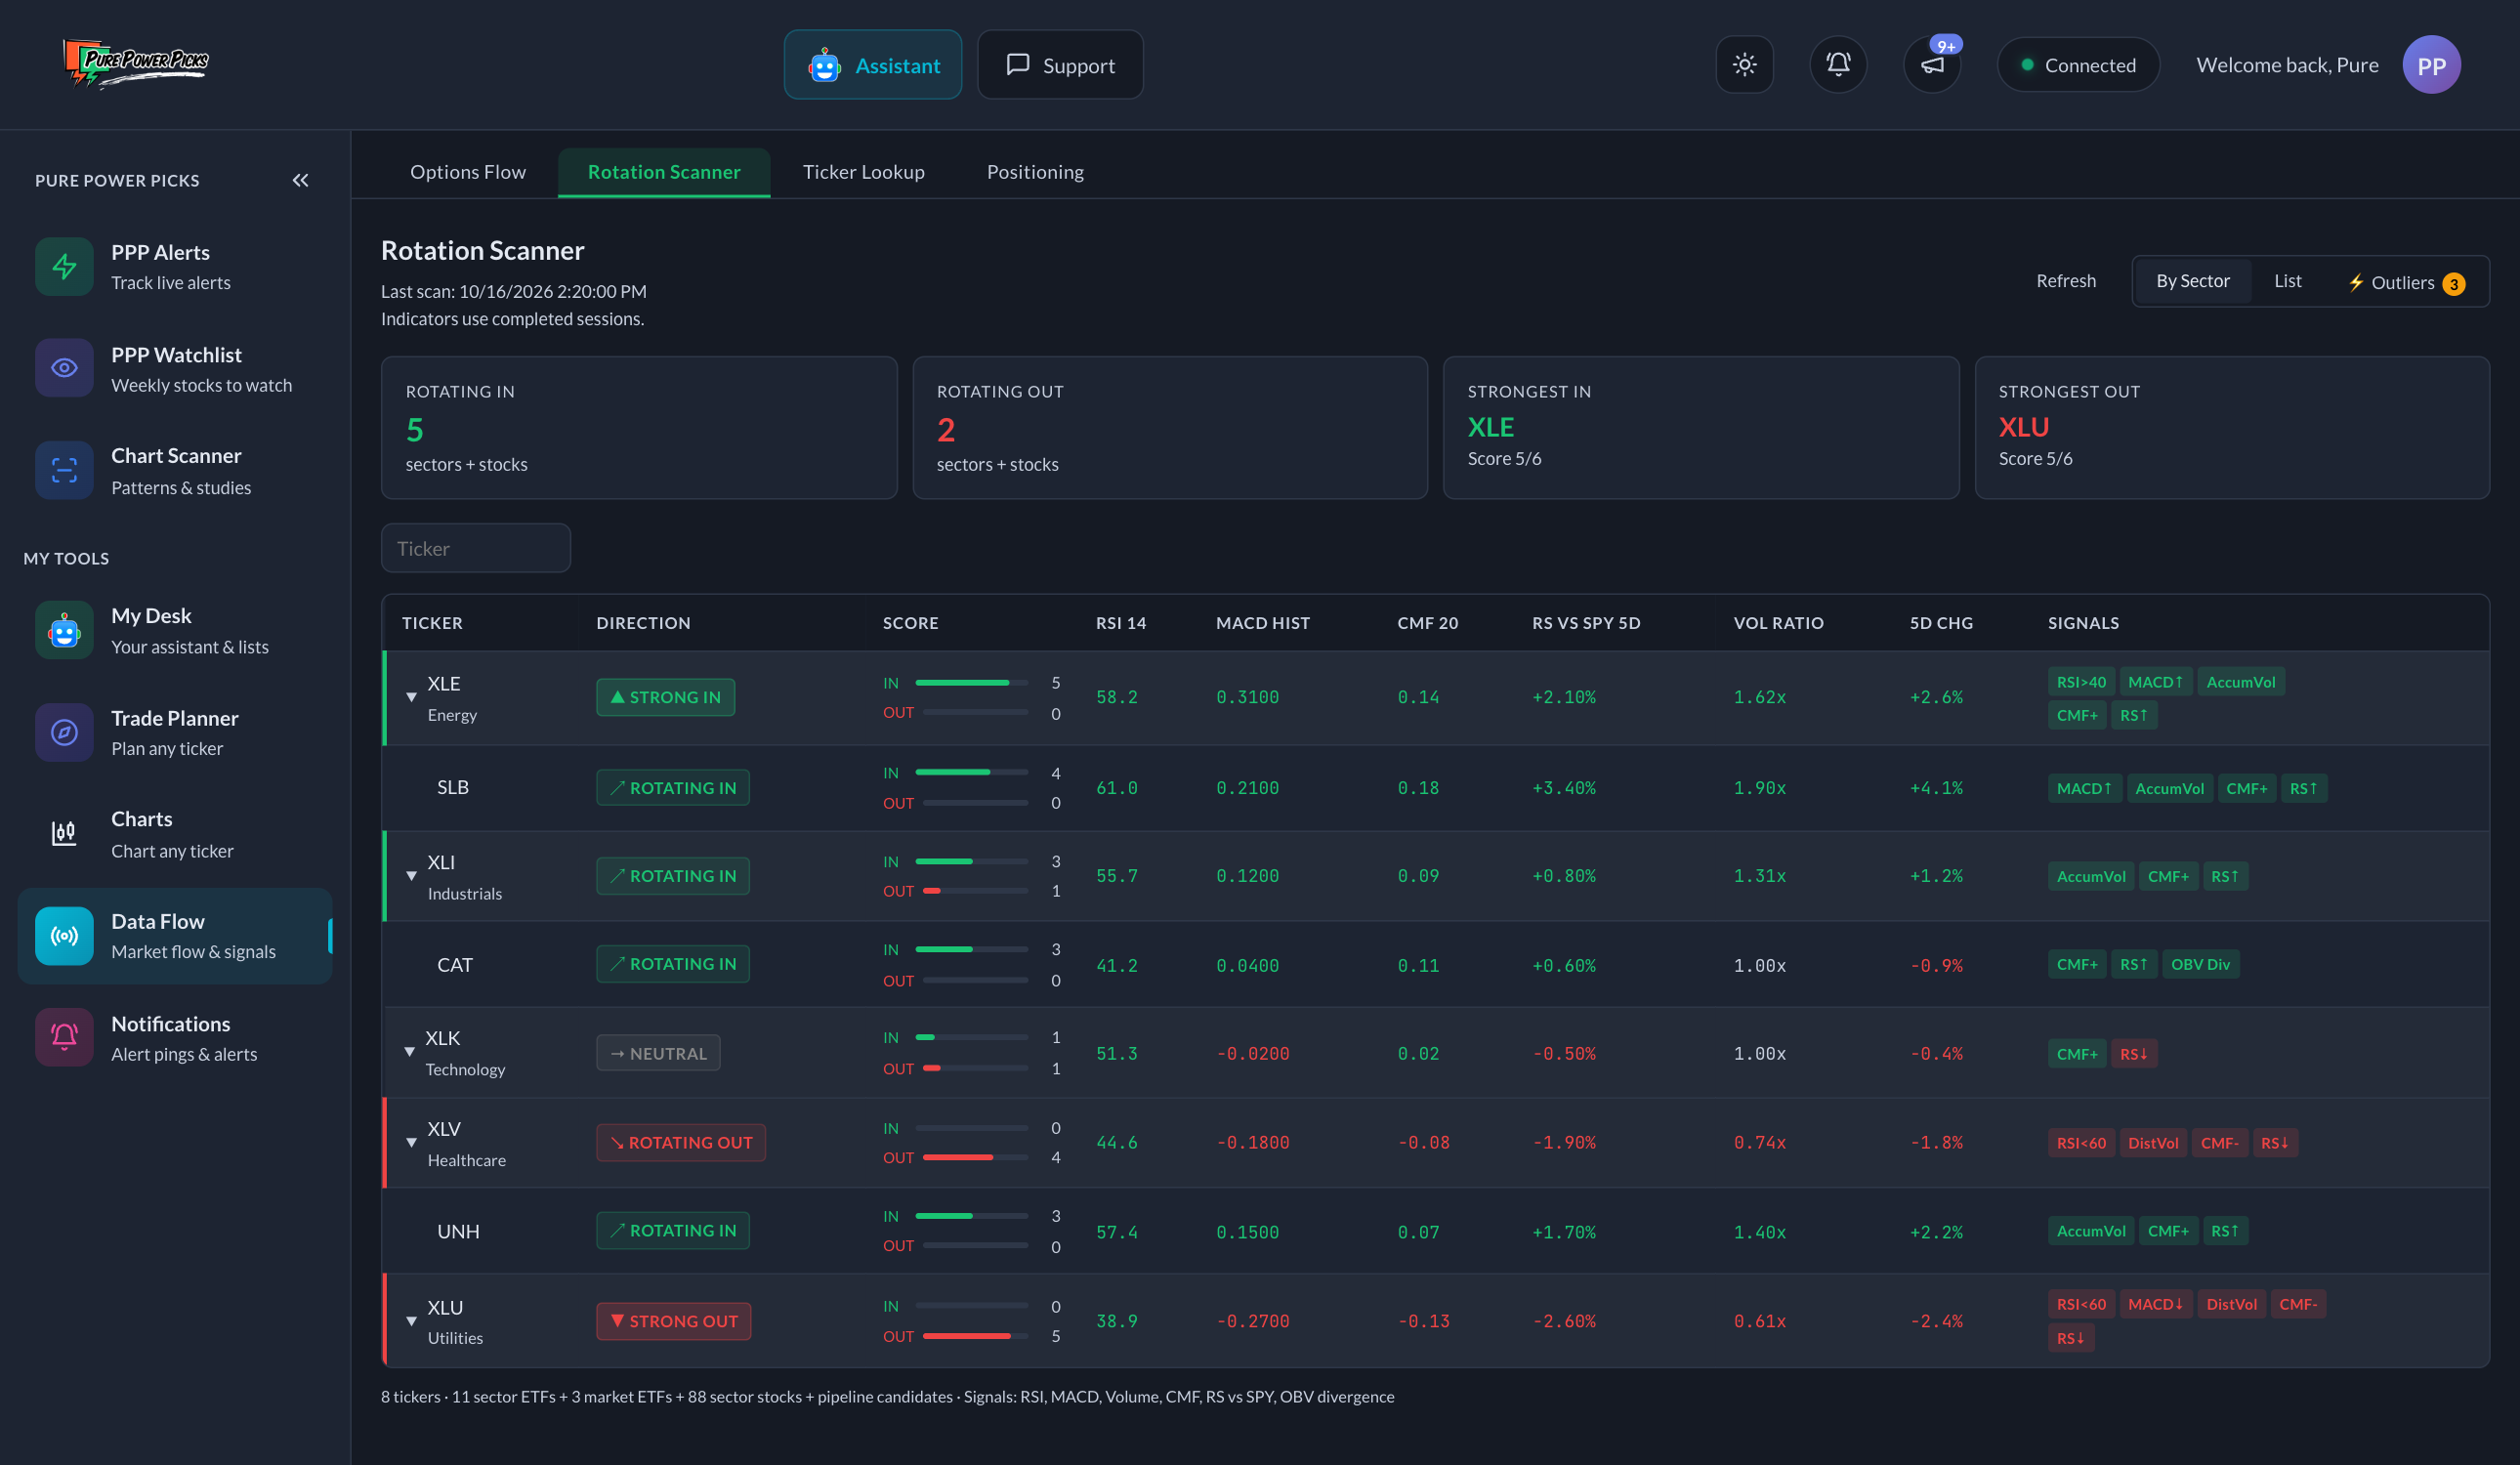
Sample data, for illustration.
The six signals (each side)
Each check looks for early evidence, deliberately including signals that fire before price makes it obvious:
| Signal | Rotation IN (bullish) version | Rotation OUT (bearish) version |
|---|---|---|
| RSI | Momentum recovering — RSI crossing back above 40 from below, or RSI clearly improving while price is still down on the week (bullish divergence) | Momentum fading — RSI dropping back under 60 from above, or RSI clearly weakening while price is still up on the week (bearish divergence) |
| MACD | Downside momentum shrinking (histogram rising while still negative) | Upside momentum shrinking (histogram falling while still positive) |
| Volume | Up days getting noticeably more volume than down days (1.25×+) | Down days getting the volume — up-day volume under 0.8× down-day volume |
| Money flow (CMF) | Positive and improving — dollars leaning into strength | Negative and worsening — dollars leaning into weakness |
| Relative strength | Beating SPY by more than 0.5% over the last 5 sessions | Trailing SPY by more than 0.5% over the last 5 sessions |
| OBV divergence | Cumulative volume rising while price still falls — quiet accumulation | Cumulative volume falling while price still rises — quiet distribution |
The In score and Out score (each 0–6) are simply how many checks fired. Direction comes from the balance:
- ▲ Strong In / ▼ Strong Out — five or six signals agree. Rare and worth attention.
- ↗ Rotating In / ↘ Rotating Out — three or four agree, and clearly more than the other side.
- → Neutral — no meaningful agreement. Most tickers, most days.
The stats on each row or card
- RSI 14 — momentum on a 0–100 scale. Under 40 = weak/oversold territory, over 60 = strong/stretched, between = neutral.
- MACD Hist — the gap between short-term and longer-term momentum. Positive and growing = strengthening; the change matters more than the level.
- CMF 20 — Chaikin Money Flow: whether volume concentrates on up days (positive, accumulation) or down days (negative, distribution) over ~4 weeks. Shown as a decimal from -1 to +1; in practice anything past ±0.20 is strong.
- RS vs SPY 5d — this ticker's return minus the market's over five sessions. The purest "is money favoring this?" number.
- Vol Ratio — average up-day volume ÷ average down-day volume over two weeks. Above 1 = buyers pressing harder.
- 5d Chg — plain price change over five sessions, for context.
All indicators are computed on completed trading days only — a half-finished session never sneaks into the math.
Outliers — the interesting list
The ⚡ Outliers view flags stocks moving independently of their own sector — a stock rotating in while its sector is flat or bleeding, or rolling over while its sector is fine. It also catches regime changes: RSI bouncing from oversold, money flow flipping sign, MACD crossing zero, a volume surge. Two independent signals minimum to make the list.
Why outliers matter: when a whole sector moves, a stock in it moving too is just the tide. A stock moving against its tide has its own story — which is exactly the kind of name worth researching.
Rotation scores describe what six indicators did — they don't predict what happens next, and a "Strong In" sector can reverse next week. Use the scanner to notice drift early and direct your own research, not as a reason to act by itself.