Data Flow
Data Flow is the tracker's market-activity area: where options money concentrated today, which sectors money is drifting into and out of, and a deep-dive lookup for any single ticker.
It has four tools:
| Tool | The question it answers |
|---|---|
| Options Flow | Which option contracts saw unusually heavy activity today? |
| Rotation Scanner | Which sectors and stocks is money moving into — or out of? |
| Ticker Lookup | What's the full options picture on this one ticker, right now? |
| Positioning | What positions actually stayed open overnight — and where is hedging pressure sitting? |
You'll find Data Flow in the sidebar under My Tools (the Flow tab in the bottom bar on mobile). All four tools live inside the one tab.
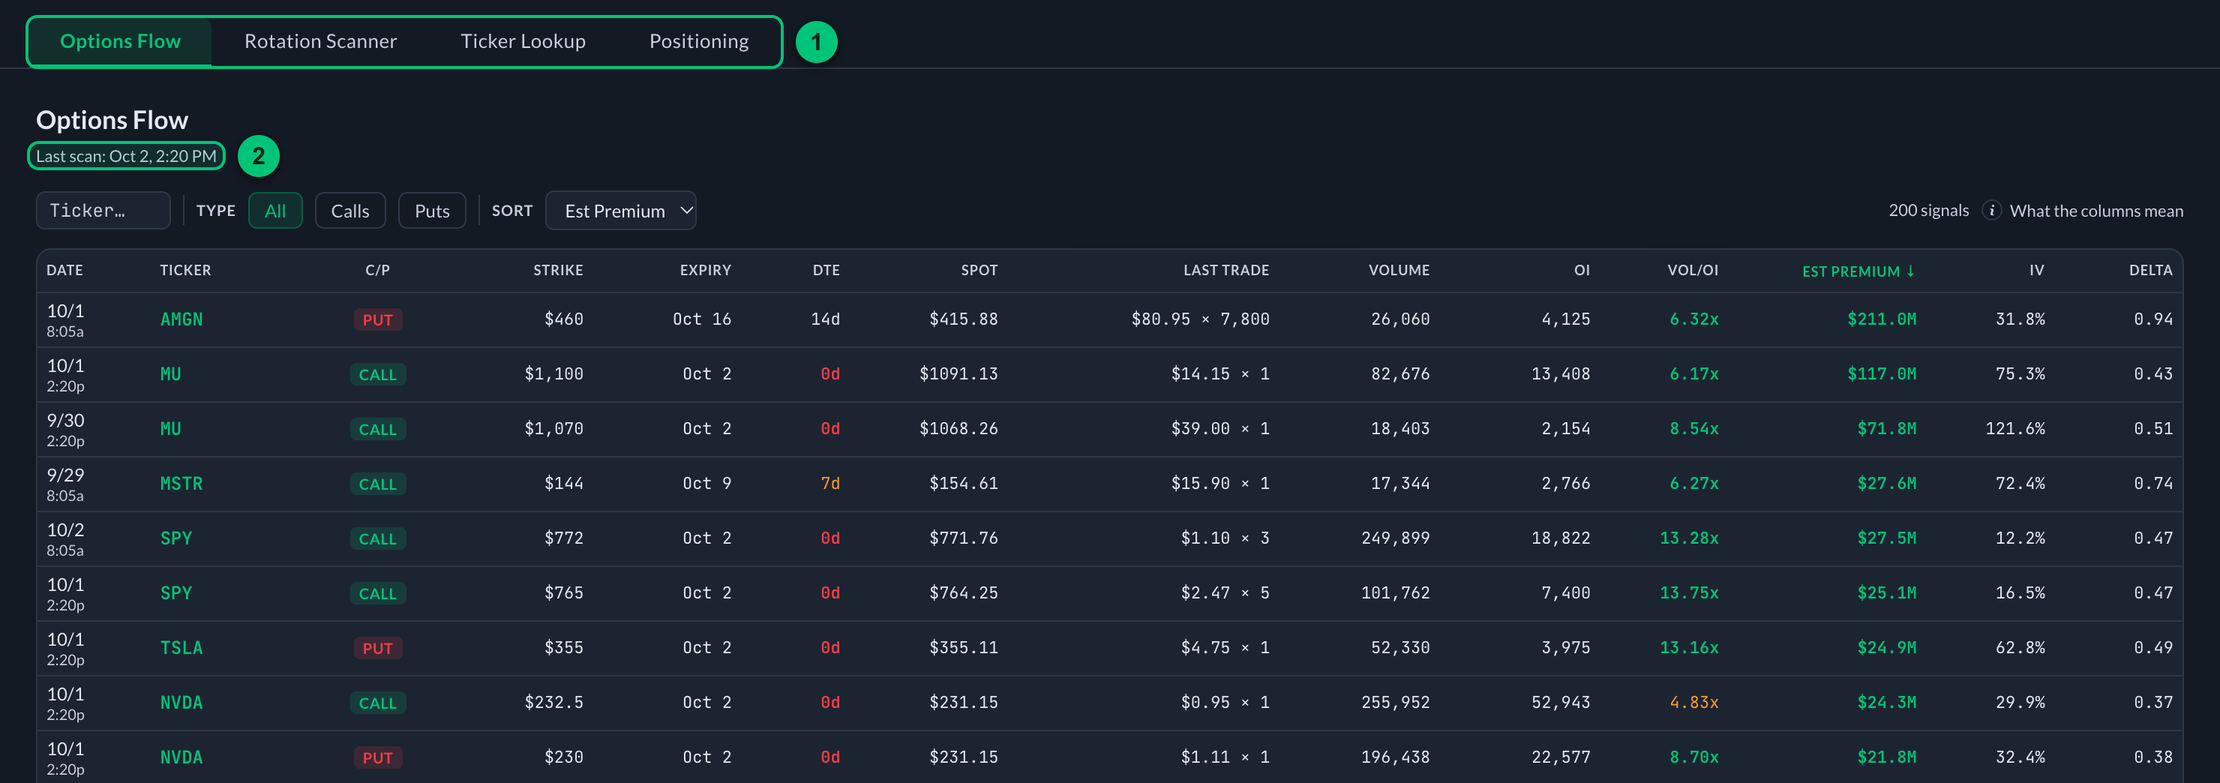
① Tabs — the four tools: Options Flow, Rotation Scanner, Ticker Lookup and Positioning. ② Last scan — when this page's data was last updated.
The three rules for reading activity data
Everything in Data Flow describes activity — where money went. Activity is genuinely useful context, but it gets misread constantly. Three rules keep it honest, and every screen in this area is built around them:
1. Volume can't tell buyers from sellers. When $2M of puts trade, that's $2M of put contracts changing hands. It could be bearish bets, protection buying on shares someone owns, or income traders selling puts they're happy to be assigned on. All three look identical in volume data. So Data Flow tells you where money concentrated, never which way it leans.
2. Unusual means unusual — not right. A contract trading at 5× its open interest is genuinely abnormal, and abnormal is worth noticing. But plenty of unusual activity is hedging, rebalancing, or somebody's mistake. It's a starting point for your own homework, not a conclusion.
3. The data is end-of-day style, 15-minute delayed. Scans run on a schedule (not tick-by-tick), and quotes are delayed 15 minutes. That's fine for what these tools do — spotting concentration and drift, which develop over hours and days — and it's why nothing here is presented as a live tape.
Nothing in Data Flow is a recommendation, a signal to act on, or a prediction. It's a window into what the options and equity markets actually did, plus the vocabulary to understand it. What you do with that context is entirely yours.
Where the numbers come from
Scans run automatically on weekdays — the Options Flow scan twice a day (mid-morning and just after the close), the Rotation scan twice as well (mid-session and post-close), and the Positioning pipeline after each close with an open-interest check the next morning. Ticker Lookup fetches fresh when you ask. Each page shows when its data was last updated.