Options Flow
Twice each trading day, the scanner sweeps the option chains of roughly 500 liquid stocks and ETFs looking for contracts trading far more than usual. What qualifies:
- Volume at least 1.5× open interest — more contracts traded today than the unusualness baseline suggests should exist, and
- At least $50K in estimated premium — enough money that it isn't noise, and
- At least 100 contracts — thin flukes are dropped.
Each row in the table is one contract that cleared all three bars.
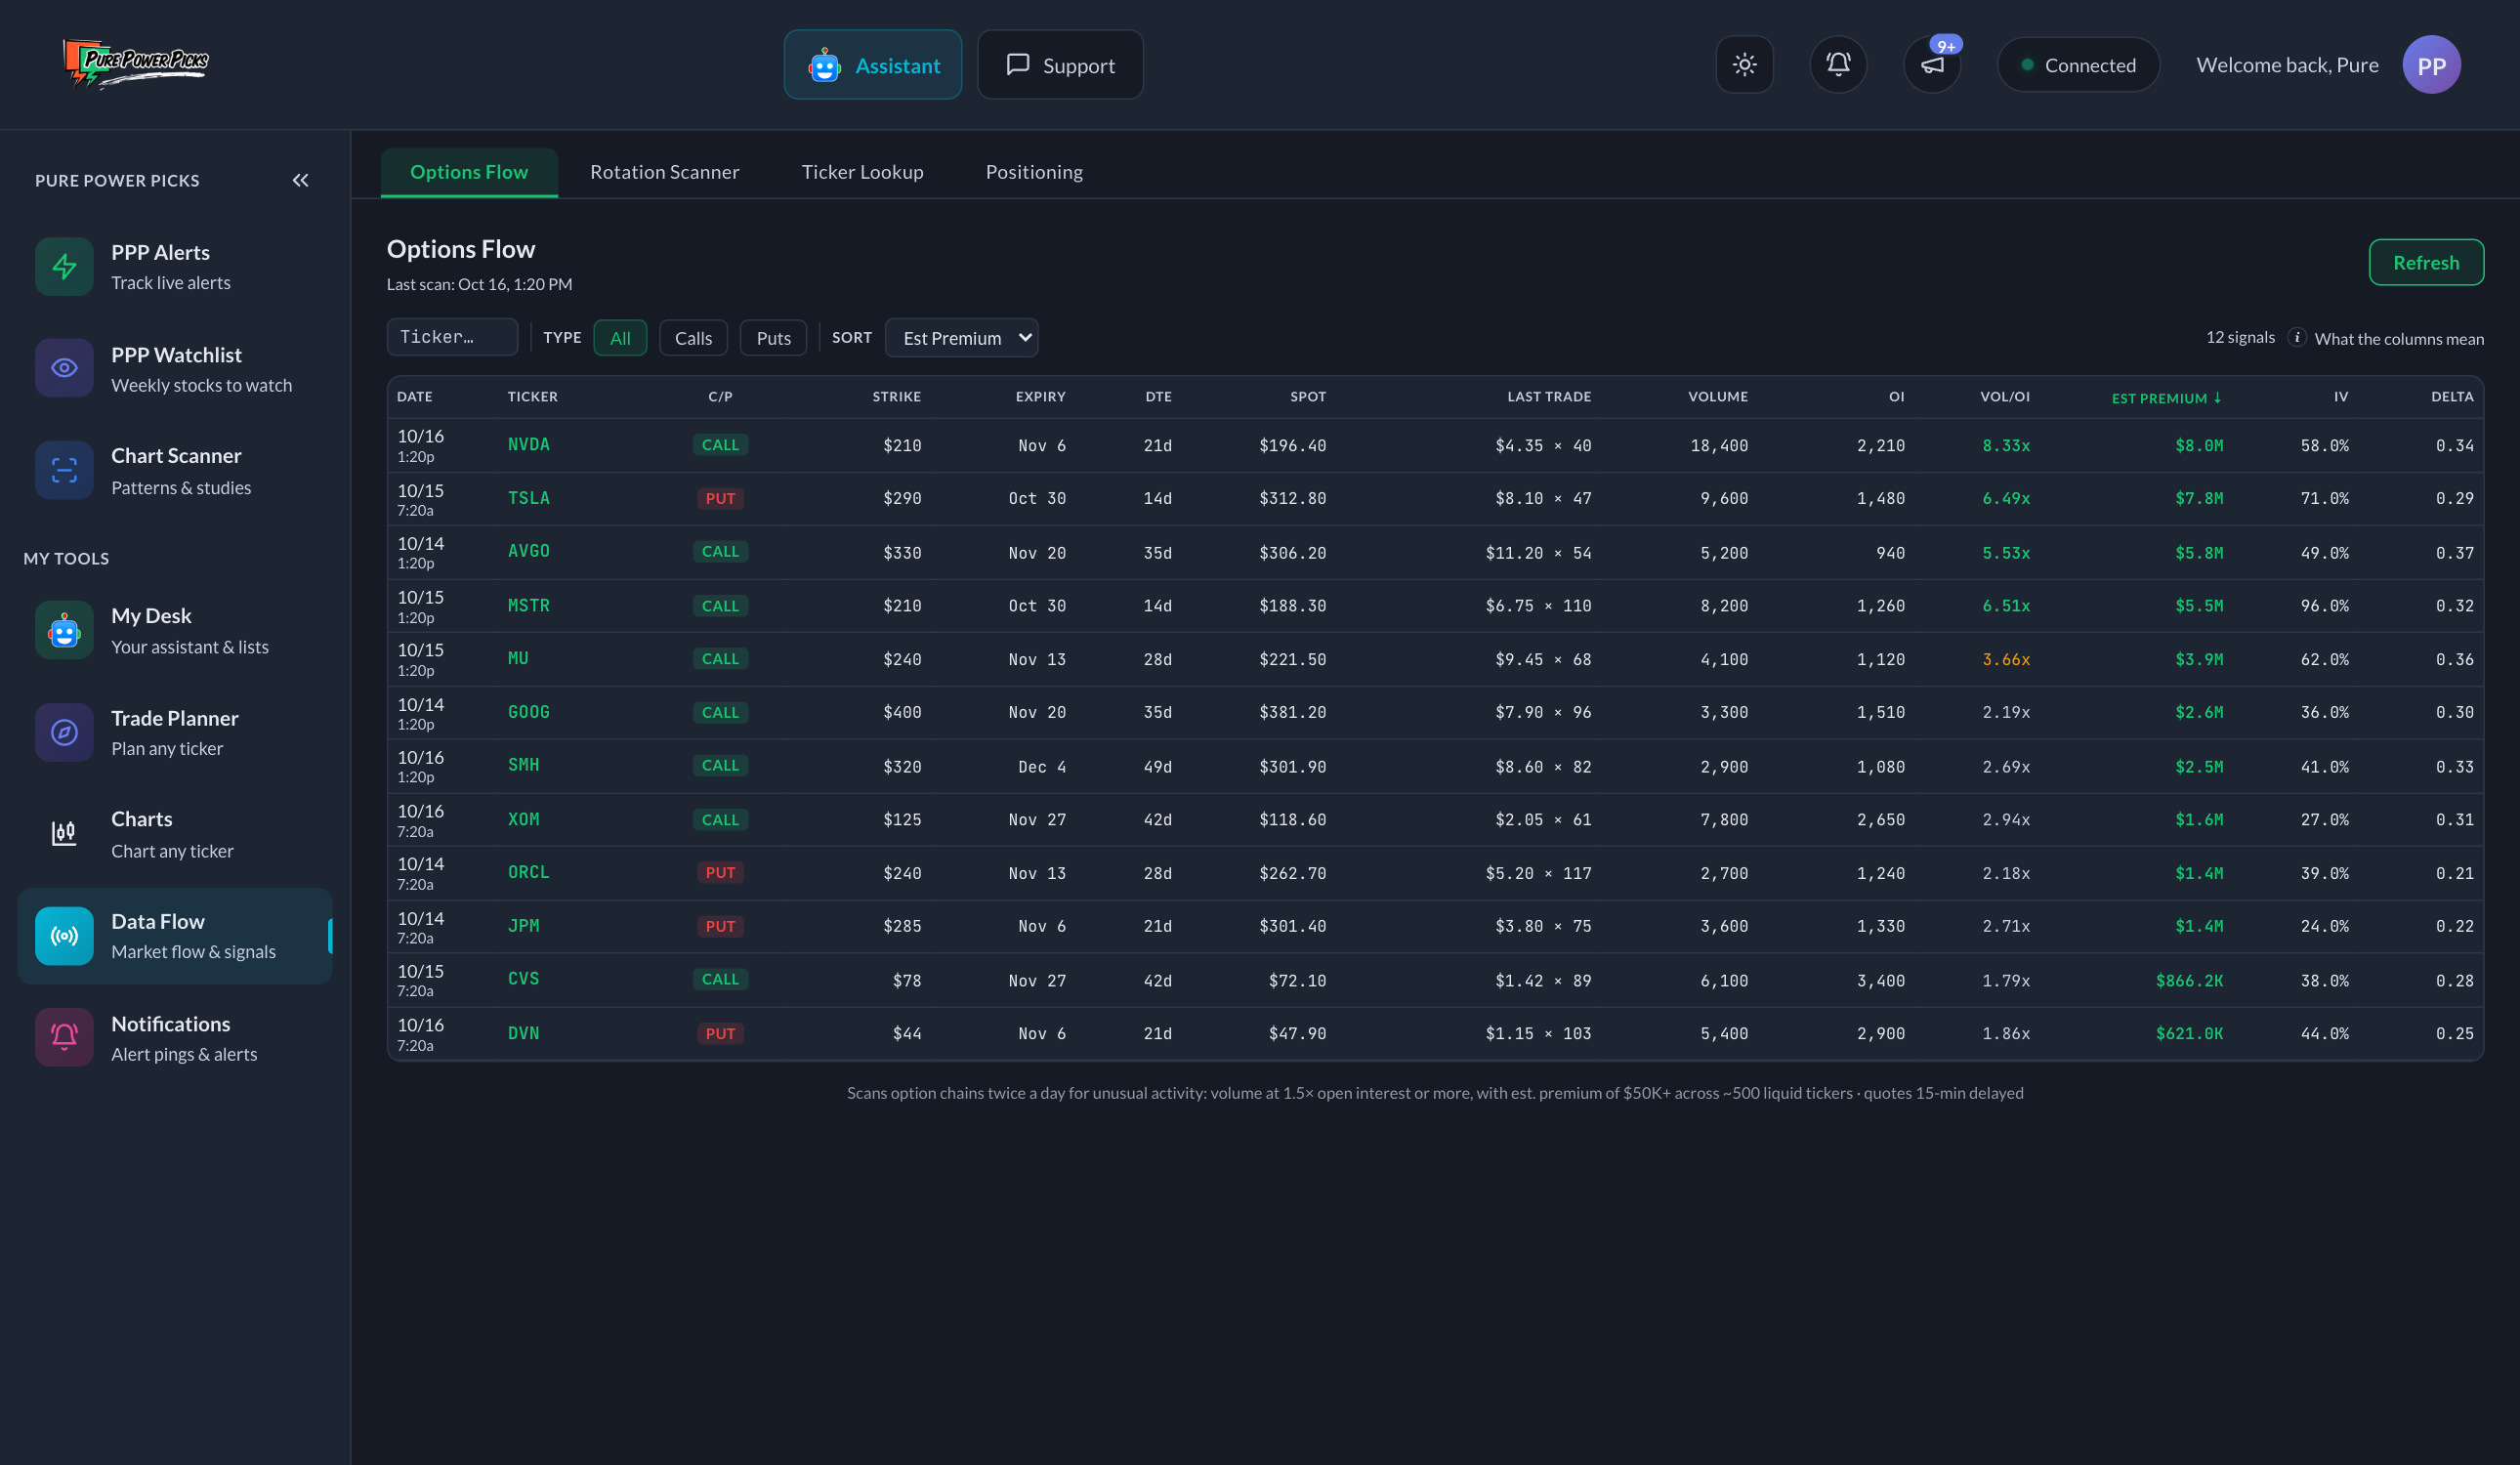
Sample data, for illustration.
Every column, explained
| Column | What it means |
|---|---|
| Date | When our scan saw this row. Scans run twice a day — during the morning session and again after the close. |
| Ticker | The stock the option is on. |
| C/P | Call (gains if the stock rises) or Put (gains if it falls). |
| Strike | The price the contract is built around. |
| Expiry / DTE | When the contract ends, and how many days are left. Short DTE means the bet needs to work fast. |
| Spot | The stock's own price at scan time. Compare it to the strike to see how far away the bet is. |
| Last Trade | The most recent option trade — price and size. |
| Volume | Contracts traded today. |
| OI (Open Interest) | Contracts that already existed before today. This is the baseline that makes volume meaningful. |
| Vol/OI | Today's volume divided by open interest. This is the star column. 1.5× is unusual; 5×+ means far more traded today than existed yesterday — genuinely new activity, not old positions shuffling around. |
| Est Premium | Estimated dollars traded: volume × last price × 100. An approximation (it values the whole day's volume at the last print), which is why it says Est. |
| IV | Implied volatility — the size of move the market is pricing in. High IV means big swings expected and expensive options. |
| Delta | Roughly the market's odds that the contract finishes in the money. 0.30 ≈ a 30% shot. |
How to actually use it
A sensible reading routine, in order:
- Sort by Vol/OI to find the most abnormal activity, or by Est Premium to find the biggest money.
- Check DTE and strike distance. $500K in calls 5% out with three weeks left is a very different statement than $500K in calls 40% out expiring Friday (the second is a lottery ticket or a hedge).
- Look for repetition. One unusual day is a data point. The same ticker showing up scan after scan is a pattern — the Ticker Lookup tab's Stored Signals section counts exactly this.
- Then do your own work. Check the chart, the news, upcoming earnings. Flow tells you where to look, not what to conclude.
Whether the volume was bought or sold. Heavy call volume can be bullish buying — or covered-call selling against shares. Heavy put volume can be bearish — or protection. Anyone who tells you flow data alone shows "smart money buying" is over-reading it. We deliberately don't.
Why some things are missing on purpose
You may have seen flow tools elsewhere advertise "sweeps" or "aggressive orders." Detecting those requires trade-by-trade tape data with exchange timestamps. Our data is daily aggregates, so we don't show sweep flags rather than fake them. Same reason there's no dark pool feed here. What we do show — volume vs. open interest, premium concentration, IV, delta — is computed honestly from data that supports it.