Ticker Lookup
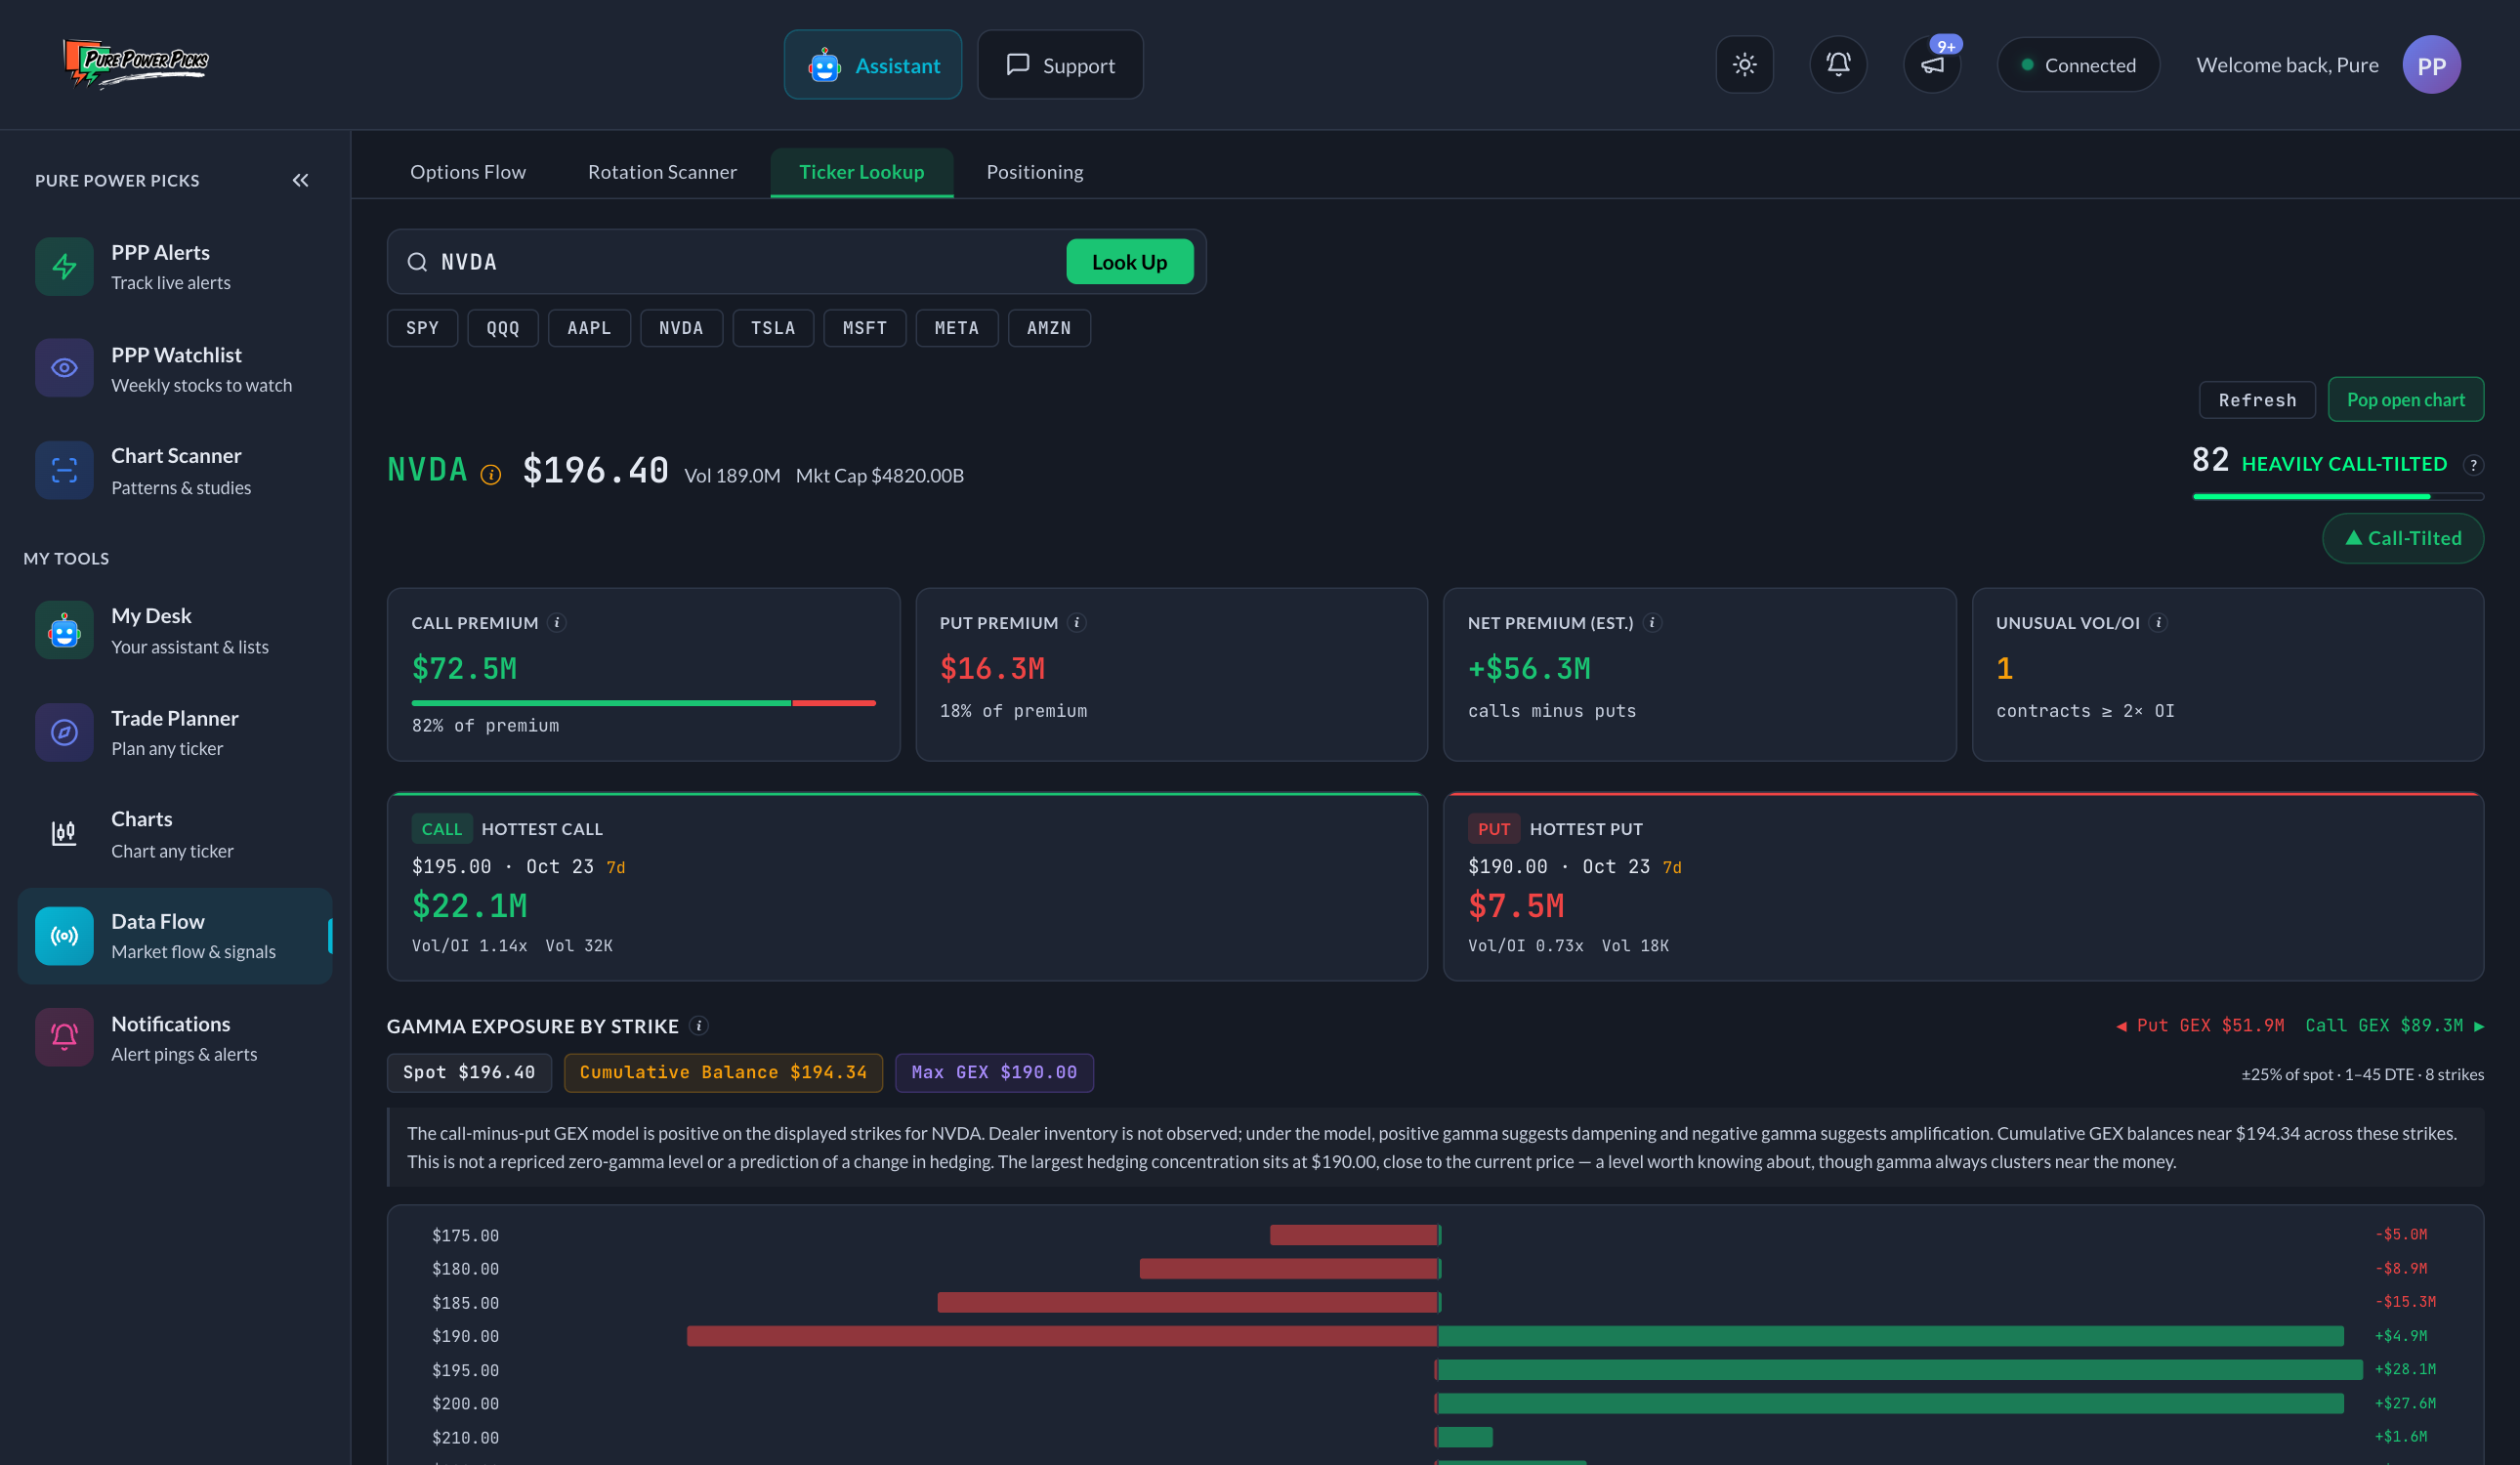
Type any ticker and get its full options picture on demand: where today's option money concentrated, where market makers' hedging pressure sits, and which contracts are trading unusually. Every technical stat on the page has a tap-for-info ⓘ bubble; this page is the full version.
Sample data, for illustration.
Premium Skew (the score up top)
One number, 0–100: the call share of today's estimated option premium. 100 means every option dollar went through calls; 0 means all puts; 50 is balanced.
Why we call it a skew and not a sentiment: daily volume cannot tell buyers from sellers. Heavy put premium can be bearish bets or protection buying or income sellers writing puts. The number honestly tells you where the money concentrated — upside contracts or downside contracts — and stops there.
The premium cards
- Call Premium — estimated dollars through this ticker's calls today (each contract's volume × last price × 100).
- Put Premium — the same through puts.
- Net Premium (est.) — calls minus puts. Green = more through calls today, red = more through puts.
- Unusual Vol/OI — how many contracts traded at 2× their open interest or more today, counted among the ticker's top 50 contracts by premium. Open interest is how many contracts existed before today, so 2×+ means more changed hands today than existed yesterday: genuinely new activity.
Gamma Exposure (GEX) — the hedging map
This is the most technical section, and the most interesting once it clicks.
Sample data, for illustration.
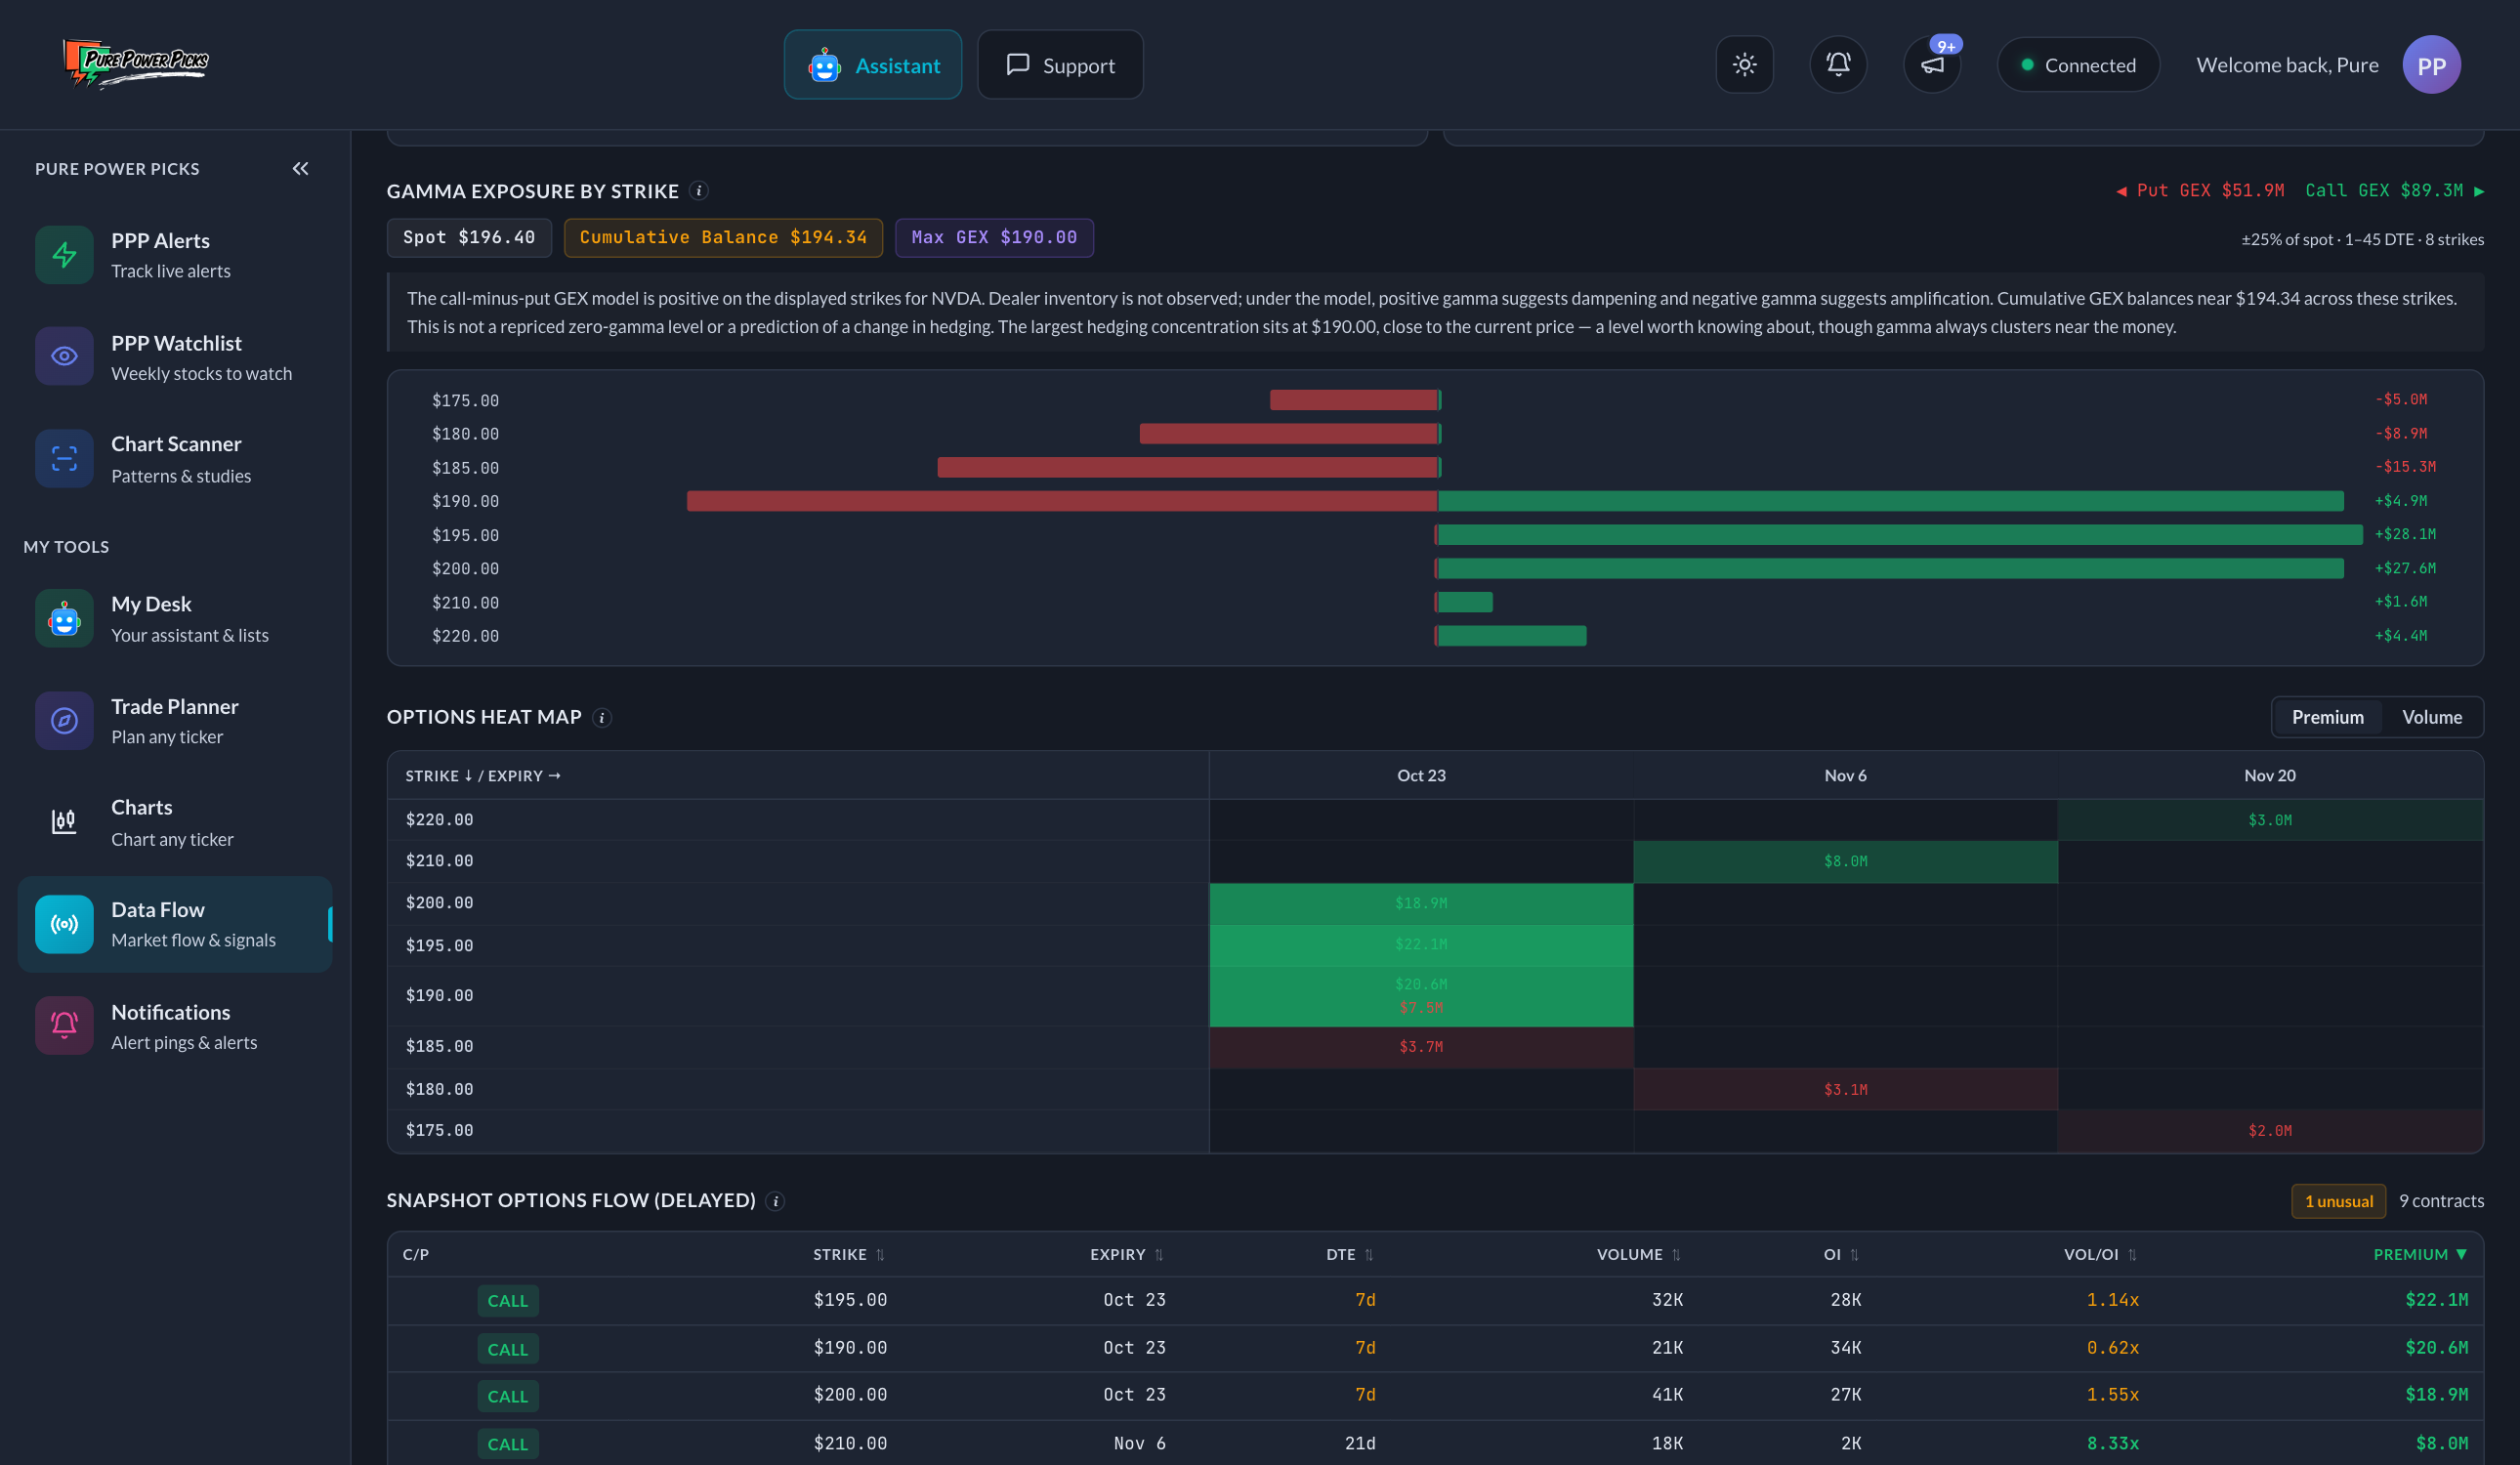
When someone buys an option, a market maker usually takes the other side — and market makers don't want directional risk, so they buy and sell the actual stock to stay neutral. That forced hedging is real buying and selling pressure, and it clusters at specific strikes. GEX estimates how much sits at each one.
- Green bars (call GEX) — strikes where hedging tends to dampen movement. As price approaches, hedgers sell into rallies and buy dips near it — the strike acts sticky, like a magnet.
- Red bars (put GEX) — strikes where hedging tends to amplify movement. Price falling toward heavy put strikes forces hedgers to sell more as it falls.
- Gamma Flip — the level where the balance changes sign. Above it, hedging pressure generally calms the stock; below it, hedging can accelerate moves. A stock trading under its flip level tends to be a wilder ride.
- Max GEX strike — the strike with the biggest hedging concentration. Near expiration, price sometimes gravitates toward heavily-loaded strikes, though it is a tendency, not a rule.
The chart covers strikes within ±25% of the stock price on contracts expiring within the next 45 days (very short-dated contracts are excluded — their gamma appears and vanishes within a day). On enormous chains like the index ETFs you may see a ⚠ Partial chain badge: the chain is bigger than one pull can cover, so treat the levels as approximate.
Gamma explains why price might slow down or speed up at a level. It says nothing about which way the stock is headed. It's context for levels you already care about — never a forecast.
Options Heat Map
Every strike × expiry combination as a grid: green intensity for call activity, red for put activity. One glance answers "which prices and dates is the options crowd focused on?" A bright cell far above the current price on a March expiry, for example, means real money is interested in that price by that date — make of it what you will, but now you know where the interest is.
Today's Options Flow (the table)
The ticker's top 50 contracts by estimated premium today: strike, expiry, DTE, volume, open interest, vol/OI, and premium. Tap any row for its delta and break-even. Quotes are 15-minute delayed daily totals — they show activity, not buy/sell direction.
Stored Signals
Every time this ticker was flagged by the twice-daily unusual-activity scan in the last 30 days. One appearance is a data point. A ticker that shows up week after week keeps attracting unusual options money — that persistence is often more informative than any single day.