Alert Statuses
The Status badge is the single most useful thing on each alert. It's a live, plain‑language read on how the idea is doing — not based on the contract's price, but on where the stock is trading versus the key levels in the alert's thesis (support, resistance, and targets).
Think of it as a traffic light: green = on track, amber/orange = pay attention, purple = a special situation.
Statuses update automatically as the stock moves. An alert can also carry a secondary badge — most commonly Near Expiration — alongside its main status.
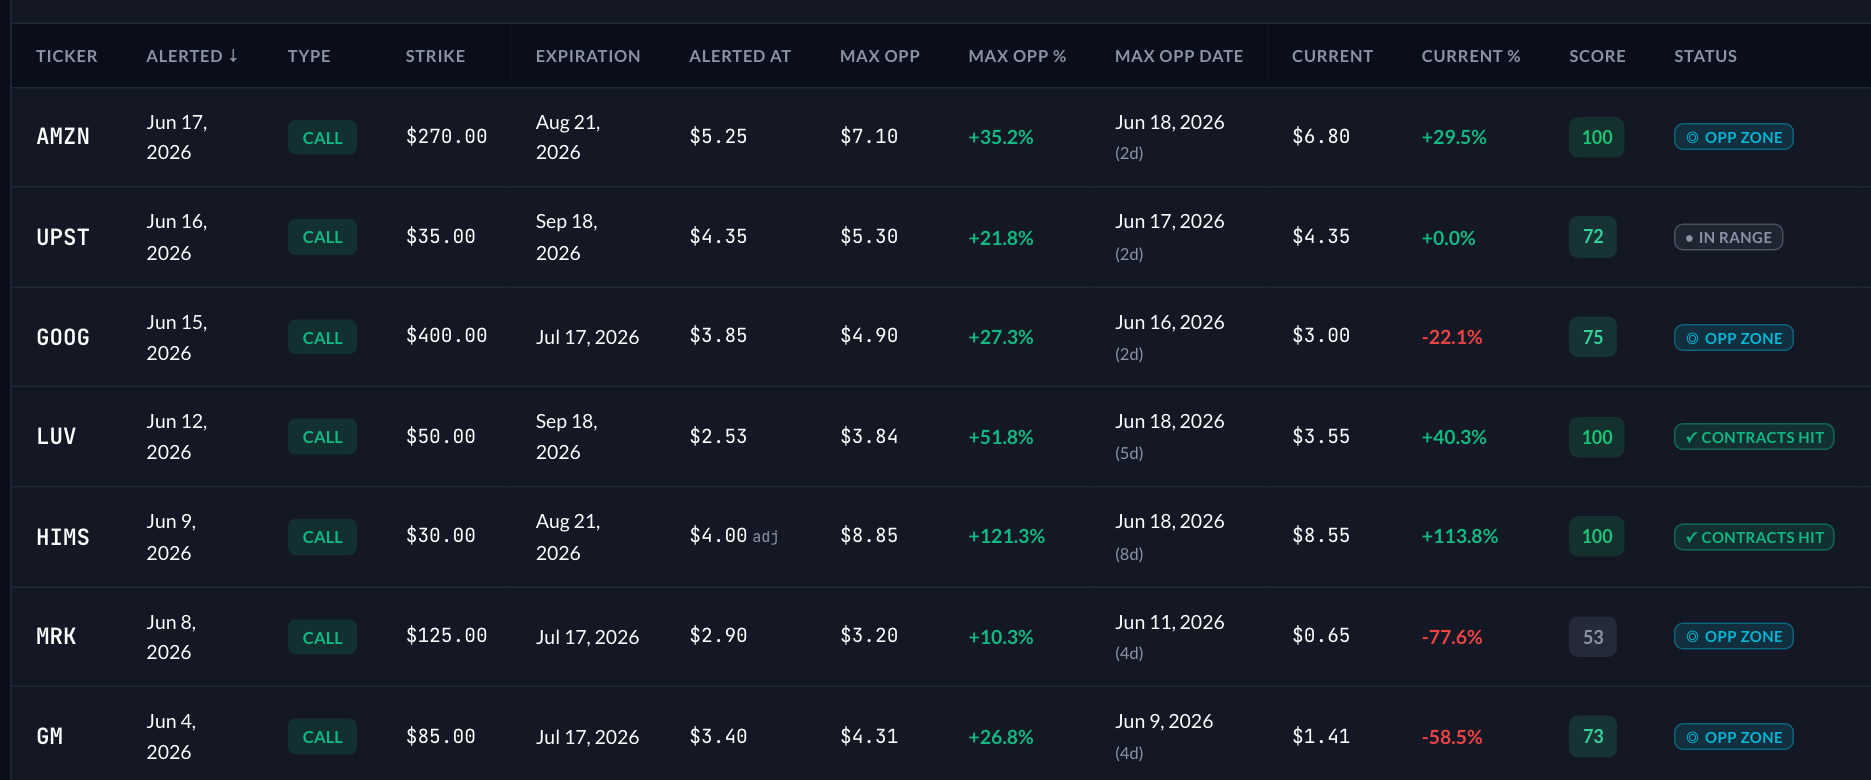
The Status column at a glance — here you can see Opportunity Zone (cyan), In Range (gray), and Contracts Hit (green) all live on real alerts.
The full list
| Status | Icon | Color | What it's telling you |
|---|---|---|---|
| All Targets Hit | ✓ | Green | The contract reached all of its targets (the 10%, 25%, and 50% opportunity levels). The idea fully played out. |
| Opportunity Zone | ◎ | Cyan | The stock is sitting right near support (for calls) or resistance (for puts) — historically the most attractive area of the thesis. |
| At Risk | ⚠ | Amber | The stock has broken a key level, or has spent 5+ days on the wrong side of it. The thesis is under pressure. |
| Recovery | ↩ | Purple | The stock had broken its critical level but has climbed back to the right side of it. A comeback in progress. |
| Overextended | ⚡ | Orange | The stock has hit most of its targets (2+) with little room left. Strong — but possibly running out of fuel. |
| Working | ↑↑ | Bright green | The stock has hit at least one target with more still ahead. Progressing as planned. |
| Extended | ↑ | Light green | The stock is within ~3% of its next target but hasn't tagged it yet. Knocking on the door. |
| In Range | • | Gray | The stock is between support and the first target. Thesis intact, nothing dramatic happening — the normal "nothing to report" state. |
| Near Expiration | ⏰ | Yellow | A secondary badge: the contract expires within 21 days. Always shown next to one of the statuses above, as a heads‑up on time. |
How the "main" status is chosen
A stock can technically satisfy more than one condition at once, so the tracker shows the most important one using this priority order:
- All Targets Hit — if everything's done, nothing else matters.
- Opportunity Zone — the best re‑entry areas surface first.
- At Risk — danger gets flagged before anything routine.
- Recovery
- Overextended
- Working
- Extended
- In Range — the catch‑all when nothing special is happening.
Near Expiration is never the main status — it rides along as a second badge.
What drives these (the levels)
Every status comes from comparing the live stock price to the levels in the alert's thesis:
- Support (S1, S2) — floors the stock is expected to hold (the basis for a call).
- Resistance (R1, R2) — ceilings the stock is expected to stay under (the basis for a put).
- Targets (T1, T2, T3) — the prices the thesis is aiming for.
- Critical level / stop — the price that, if broken, means the idea is invalidated.
You can see all of these spelled out on each alert's detail page, and they're defined in the Glossary.
On the home page you can filter the table to just the statuses you care about — for example, show only Opportunity Zone alerts to find ideas sitting near support, or only At Risk to see what needs attention. See Filters, Views & Analytics.
A status describes the stock's progress against the thesis, not a profit or loss on any position. "Working" means the underlying is doing what the idea expected — the contract's own price is shown separately in the Current % column.